


- Contents
PureConnect CX Insights Help
CX Insights Overview
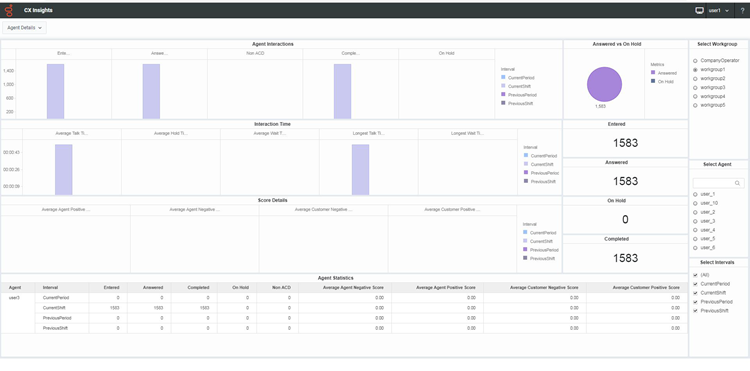
CX Insights helps you understand the current state of your contact center. CX Insights is a web-based data visualization application that allows you to view and analyze real-time agent status and workgroup activity. CX Insights dashboard visualizations displays agent details for a workgroup, including the number of agents available, time in status, total interactions answered and completed, average handling times, and more.
Dashboard Visualizations`
CX Insights agent dashboard visualizations help you monitor agent status and agent interaction details in real time. Workgroup dashboard visualizations give supervisors a quick view of the available agents and their current states.
CX Insights dashboard filtering and sorting capabilities provide extra insight into waiting interactions and agents' current states. You can filter the data displayed in a dashboard to display only the information that you require. You can also filter at multiple levels. Simultaneously, you can filter the data displayed on every visualization of the dashboard. For example, one visualization on a dashboard contains a bar chart about the agent time in status where you can filter by different workgroups. Another visualization can be a grid displaying abandon rate, which you can filter on the media type and workgroup for a specific interval.
Next, read more About Dashboards.
Designer User Dashboards
Designer license users have configuration access for the CX Insights web application. You can create, view, edit, copy, and share the real-time dashboards, and you can export it to the required file format. For IVR Dashboards, you can copy and share dashboards. For more information, see Designer User Capabilities.