- Contents
Interaction Reporter Help
Annotating a Report
Use the Annotations button  to add text and graphics to a report displayed in the Workspace.
To annotate your report:
-
Click the Annotations button. The Annotations drop-down menu displays the annotation types.

To display the name of an Annotation type, from the Annotations drop-down menu, on the Workspace, pause your mouse over a graphic. The Annotation types are: Text, Circle, Rectangle, Arrow, Balloon, Line and Image. -
Drag an annotation type from the drop-down menu to the report.
-
Size the graphic by dragging one of the graphic anchors.
Adding a graphic with text
-
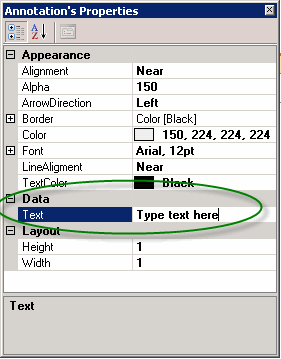
You can add text to the Text, Arrow, Balloon, Line, and Image Annotation types. To add a graphic that includes the text option, after dragging the graphic to the report, right-click on the graphic and on the shortcut menu, select Properties. The Annotation's Properties dialog is displayed.

-
In the Data box, select Text. Type your text in the box next to the Text property.
-
Close the Annotation's Properties dialog to view your text in the report.
Adding a graphic without text
To highlight an area of your report, you can add a circle or rectangle from the Annotations drop-down menu. Use the Annotation's Properties dialog to change the appearance of the graphic and to emphasis an area of your report. For example, you can create a circle and adjust the color and transparency to highlight a section of your report.


