


- Contents
Interaction Reporter Help
Queue Period Statistics Response Report
The Queue Period Statistics (QPS) Response report displays the percentages of all ACD interactions answered at the various service level thresholds. The service level thresholds are determined by your settings in Interaction Administrator. This report includes interactions answered, interactions entering the queue, and the percentage of interactions answered at each service level threshold.
Parameters
You specify a range of queues, dates, site IDs and the shifts to report on. IC sorts this report by queue, then by date in ascending order, by default. To group or sort a report by other fields, on the Enter Report Parameters dialog use the Report Sort/Group Order 4 page to specify another option.
|
Report Log Tables |
Interaction Administrator Unique Report Identifier |
|
IWrkgrpQueueStats |
QUEUE_PERIOD_RESPONSE |
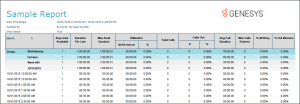
Sample report
Click on the image below to view a sample of this report.
|
Report Element |
Report Field or Value |
Field or Value Description |
|
Site ID |
SiteID |
The name of the Site ID as specified in the range |
|
Queue |
cReportGroup |
The name of the distribution queue. |
|
Date |
dIntervalStart |
The date or time of the interactions entered the distribution queue as specified in the date / time range. |
|
Ints Offered |
nEnteredACD |
The number of ACD interactions that were offered to the queue. |
|
Ints Answered |
nansweredACD |
The number of ACD interactions that were answered. |
|
Ints Aband |
nAbandonedACD |
The number of ACD interactions that were abandoned in the queue. |
|
Perc Aband |
(nAbandonedACD / nEnteredACD) * 100 |
The percentage of interactions that were abandoned in the queue. |
|
Average Speed of Answer |
tAnsweredACD / nAnsweredACD |
The average amount of time an interaction spent alerting before it was answered by the agent. The total amount of time the interactions were alerting the agents divided by the total number of ACD interactions answered for the specified range. |
|
Local disconnect |
nLocalDisconnectAcd |
The number of ACD calls that were disconnected locally. |
|
Service Threshold 1 |
(nAnsweredACDSvcLvl1 / nAnsweredACD) * 100 |
The percentage of interactions that were answered within the first service level. The first service level interval is determined in Interactive Administrator and the default first service level is 10 seconds.
|
|
Service Threshold 2 |
(nAnsweredACDSvcLvl2 / nAnsweredACD) * 100
|
The percentage of interactions that were answered within the second service level. The default second service level is 20 seconds.
|
|
Service Threshold 3 |
(nAnsweredACDSvcLvl3 / nAnsweredACD) * 100 |
The percentage of interactions that were answered within the third service level. |
|
Service Threshold 4 |
(nAnsweredACDSvcLvl4 / nAnsweredACD) * 100 |
The percentage of interactions that were answered within the fourth service level. |
|
Service Threshold 5 |
(nAnsweredACDSvcLvl5 / nAnsweredACD) * 100 |
The percentage of interactions that were answered within the fifth service level. |
|
Service Threshold 6 |
(nAnsweredACDSvcLvl6 / nAnsweredACD) * 100 |
The percentage of interactions that were answered within the sixth service level. |
|
Aband Svc Lvl 1 |
(nAbandACDSvcLvl1 / nEnteredACD) * 100 |
The percentage of interactions that were abandoned with in the first service level. |
|
Aband Svc Lvl 2
|
(nAbandACDSvcLvl1 / nEnteredACD) * 100 |
The percentage of interactions that were abandoned with in the first service level. |
|
Aband Svc Lvl 3
|
(nAbandACDSvcLvl1 / nEnteredACD) * 100 |
The percentage of interactions that were abandoned with in the first service level. |
|
Aband Svc Lvl 4 |
(nAbandACDSvcLvl1 / nEnteredACD) * 100 |
The percentage of interactions that were abandoned with in the first service level. |
|
Aband Svc Lvl 5 |
(nAbandACDSvcLvl1 / nEnteredACD) * 100 |
The percentage of interactions that were abandoned with in the first service level. |
|
Aband Svc Lvl 6 |
(nAbandACDSvcLvl1 / nEnteredACD) * 100 |
The percentage of interactions that were abandoned with in the first service level. |
|
Accumulative Abandoned and Answered |
Uses the above calculations, but as service Thresholds go up, the sum of the previous answered or abandoned is added to the current service Threshold. |
The percentage of interactions that were abandoned or answered in a given service level. The last service level will not always have a value of 100 percent, since any interactions that exceeded the last service level threshold will not be counted. |
Record selection criteria for this report includes:
{QueueStats.DINTERVALSTART} in {?DateTime} and
{QueueStats.CTYPE} = {QueueStats.CTYPE} and
{QueueStats.CREPORTGROUP} in {?ReportGroup} and
{QueueStats.SITEID} in {?SiteId} and
{@StatusTime} IN {?ShiftTime} and
{QueueStats.CNAME} = {?Workgroup}
Formulas:
All times are expressed as hh:mm:ss. This formula is used throughout the report to convert seconds to hh:mm:ss. This formula is external to the report file.
Ints Answered = The sum of ACD interactions answered.
Ints Offered = The sum of incoming ACD interactions that were offered to the queue.
Ints Aband = The sum of the incoming ACD interaction that were abandoned in the queue.
Avg Wait = The total amount of time the interactions were alerting the agents divided by the total number of ACD interactions answered.
Avg Abandoned Time = The sum of time the interactions were in the queue before abandoning divided by the number of interactions abandoned.
Perc Abandoned = The total number of ACD interactions that were abandoned divided by the total number of interactions that entered the ACD queue. This number is then multiplied by 100 to get the percentage.
Service Levels 1 – 6 = The total number of ACD interactions that were answered within the selected service level divided by the total number of ACD interactions that were answered. This number is then multiplied by 100 to get the percentage.
Abandoned Service Levels 1 – 6 = The total number of ACD interactions that were abandoned in the queue within the selected service level divided by the total number of interactions that entered the queue. This number is then multiplied by 100 to get the percentage.