- Contents
Interaction Scripter Developer's Guide
Interaction Scripter Debugger
Interaction Scripter offers a debugging feature that helps developers detect and resolve problems with custom campaign scripts. The debugger is available only when Interaction Scripter is started with the Debug command-line parameter.
When you run Scripter in Debug mode, it analyzes events in the current session to identify potential problems with scripts. When a problem is detected, Scripter sends an error message to the debugger. In most cases you must manually access the Debug Dialog window to view the error messages . However, the Debug Dialog window automatically opens when scenarios like the following are detected:
-
Agent sets status to Available without dispositioning the current campaign call.
-
Agent received a datapop while a disposition is pending.
-
A page unload event was called, but a corresponding onload event did not occur within 5 seconds.
-
Multiple page elements are assigned the same 'name' attribute.
-
Scripter detects COM errors related to invalid CallIDs, conference ids, etc.
-
A SetAvailability call is made while an Agent is on a call or is in 'Awaiting Callback' status.
-
Client status changes to an Available state while the Agent is processing a call.
-
A call has not been dispositioned prior to transfer.
-
A logout request occurs while in "Awaiting Callback" status.
-
An Agent's Workgroup activation changes unexpectedly.
Launch Scripter in Debug mode
To launch Scripter in Debug mode, you add the \debug parameter to the Interaction Scripter command line:
InteractionScripter.NET.exe /debug
When you do, a Debug menu appears in the Interaction Scripter window.

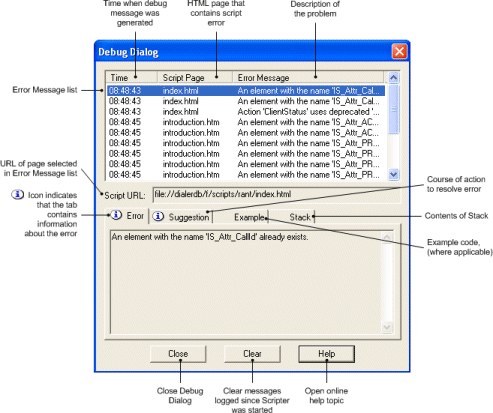
From the menu select the Show Dialog command and you'll see the Debug Dialog window. Error messages are displayed in a list at the top of the Debug Dialog. Columns in the list indicate the time, Script Page filename, and text of each error. The dialog also displays the URL of the selected script page. Tab pages on the dialog display the full text of the error message and may offer suggestions for resolving the error, script snippets that show how to resolve error, and contextual information about the scenario.

Controls on the Debug Dialog
Error Message list box
Messages are displayed in a list at the top of the Debug Dialog. Columns in the list indicate the time, Script Page filename, and text of each error.
Script URL Field
This read-only field displays the URL of the selected script page.
Close button
This button closes the Debug Dialog. If you reopen it later, messages logged since the current Scripter session started will be displayed in the list, unless messages were previously cleared.
Clear button
Removes all messages logged since Scripter was started.
Tab pages
The tab pages at the bottom of the dialog display the full text of the
selected error message, and may optionally offer suggestions for resolving
the error, example code, and other information. The  icon appears on tab
pages that are not empty.
Error
This tab displays the text of the selected error message, which may be too long to view in the message list.
Suggestion
This tab may contain suggestions for resolving the error.
Example
This tab may contain a script snippet that shows how to resolve the error. (Most messages do not have corresponding code samples.) Text in this window can be copied to the clipboard. To copy text, make a selection, press the right mouse button, and then choose Copy from the context menu.
Stack
This tab may provide contextual information regarding a situation. For example, if the script attempts to disconnect, when there is no active call object, that context would be described on the stack page.


