


- Contents
PureConnect CX Insights Help
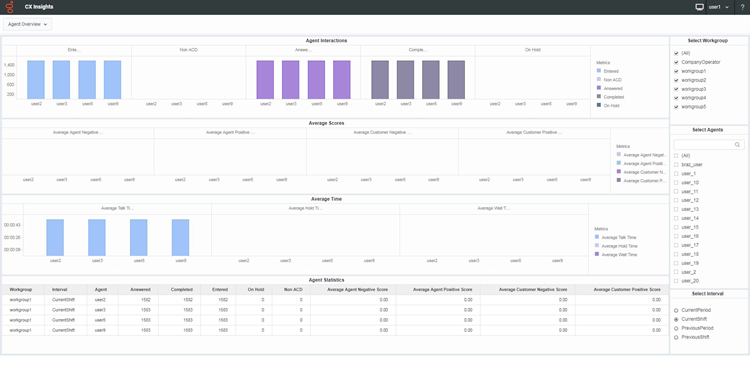
Agent Overview Dashboard
The Agent Overview dashboard provides detailed information for multiple agents, by workgroup. The visualizations display statistics for the total interactions answered, completed, and on hold, for multiple agents. The Agent Overview dashboard also displays the average handling times for agents, with their positive and negative scores.
The visualizations for the Agent Overview dashboard include Agent Interactions, Average Scores, Average Times, and Agent Statistics.
You can include or exclude data in your dashboard visualizations using the filters Select Workgroup, Select Users, and Select Interval.
Dashboard Visualizations
The following visualizations are displayed in the Agent Overview dashboard.
Agent Interactions
This bar chart visualization displays the number of interactions Entered, Non ACD, Answered, Completed, and On Hold for agents, by workgroup, for a selected interval.
Average Scores
This bar chart visualization displays the Average Agent Negative Score, Average Agent Positive Score, Average Customer Negative Score, and Average Customer Positive Score for agents, by workgroup, for a selected interval.
Average Times (hh:mm:ss)
This bar chart visualization displays the agent Average Talk Time, Average Hold Time, and Average Wait Time for a selected interval, by workgroup.
Agent Statistics
This grid visualization displays agent interaction statistics, by workgroup, for Interval, Answered, Completed, Entered, On Hold, Non ACD, Average Agent Negative Score, Average Agent Positive Score, Average Customer Negative Score, and Average Customer Positive Score.
Elements used in the Agent Overview Dashboard
The following tables provide descriptions of the dashboard visualization elements.
Agent Interactions
|
Dashboard Element |
Data Column or Computation |
Description |
|
Entered |
InteractionsEntered |
The number of agent interactions that entered the workgroup queue, for the selected intervals. |
|
Non ACD |
NonACDInteractions |
This is the number of interactions answered by an agent that were not routed to the agent by ACD. These are interoffice interactions, transfers, and other person-to-person interactions. |
|
Answered |
InteractionsAnswered |
The number of agent interactions answered, calculated as the number of ACD interactions from the specified workgroup that went to a Connected state in the agent's queue. |
|
Completed |
InteractionsCompleted |
The number of interactions completed. That is, the interaction went from a state of ACD-Assigned to ACD-Disconnected. |
Average Scores
|
Dashboard Element |
Data Column or Computation |
Description |
|
Average Agent Negative Score |
AverageAgentNegativeScore |
This is the sum of the agents negative scores divided by the total number of calls in the Current and Previous period or shift. |
|
Average Agent Positive Score |
AverageAgentPositiveScore |
This is the sum of the agents positive scores divided by the total number of calls in the Current and Previous period or shift. |
|
Average Customer Negative Score |
AverageCustomerNegativeScore |
This is the sum of the customers negative scores divided by the total number of calls in the Current and Previous period or shift. |
|
Average Customer Positive Score |
AverageCustomerPositiveScore |
This is the sum of the customers positive scores divided by the total number of calls in the Current and Previous period or shift. |
Average Times (hh:mm:ss)
|
Dashboard Element |
Data Column or Computation |
Description |
|
Average Talk Time |
AverageTalkTime |
The average amount of time (hh:mm:ss) that the agents have spent on interactions for the specified workgroup. This is the average time all interactions on the agents queue for the specified workgroup have been in the ACD-Assigned state. |
|
Average Hold Time |
AverageHoldTime |
The average amount of time (hh:mm:ss) that the agents have had the interactions on hold for the specified workgroup. This is the average time all ACD interactions on the agents queue for the specified workgroup have been in the Hold state. |
|
Average Wait Time |
AverageWaitTime |
The average amount of wait time (hh:mm:ss) for all interactions in the queue for a specified workgroup. That is, the average time an interaction from the specified workgroup has alerted agents in the current period. This is the average time all interactions have been in the ACD-Alerting state on the agents queue for the specified workgroup. |
Agent Statistics
|
Dashboard Element |
Data Column or Computation |
Description |
|
Workgroup |
Workgroup |
This is the name of workgroup. |
|
User |
User |
This is the name of the agent. |
|
Interval |
Interval |
This is the type of interval, for example: Current Shift, Current Period, Previous Shift, and Previous Period. |
|
Answered |
InteractionsAnswered |
This is the number of interactions answered, calculated as the number of ACD interactions from the specified workgroup that went to a Connected state in the agent's queue. |
|
Completed |
InteractionsCompleted |
this is the number of interactions complete that went from a state of ACD - Assigned to ACD - Connected. |
|
Entered |
InteractionsEntered |
This is the total number of interactions that entered the queue. |
| On Hold |
InteractionsOnHold |
The number of interactions the agent had on hold. |
| Non ACD | NonACDInteractions | This is the number of interactions answered by an agent that were not routed to the agent by ACD. These are interoffice interactions, transfers, and other person-to-person interactions. |
|
Average Agent Negative Score |
AverageAgentNegativeScore |
This is the sum of the agents negative scores divided by the total number of calls in the Current and Previous period or shift. |
|
Average Agent Positive Score |
AverageAgentPositiveScore |
This is the sum of the agents positive scores divided by the total number of calls in the Current and Previous period or shift. |
|
Average Customer Negative Score |
AverageCustomerNegativeScore |
This is the sum of the customers negative scores divided by the total number of calls in the Current and Previous period or shift. |
|
Average Customer Positive Score |
AverageCustomerPositiveScore |
This is the sum of the customers positive scores divided by the total number of calls in the Current and Previous period or shift. |