


- Contents
PureConnect CX Insights Help
Agent Status Dashboard
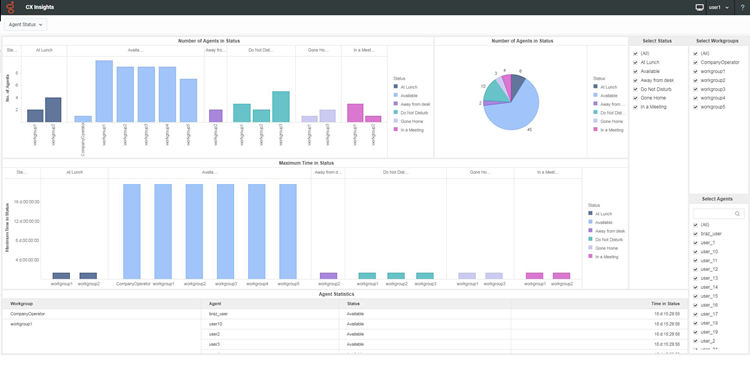
The Agent Status dashboard provides detailed information for the number of agents and their time in selected statuses, allowing you to compare between the selected workgroups and the number of agents and their statuses in those workgroups.
The visualizations for the Agent Status dashboard include the Number of Users in Status, the Maximum Time in Status, and the Agent Statistics grid, by workgroup.
You can include or exclude data in your dashboard visualizations using the filters Select Workgroup, Select Users, and Select Status.
Dashboard Visualizations
The following visualizations are displayed in the Agent Status dashboard.
Number of Users in Status
This bar chart visualization displays the number of agents and their statuses, by workgroup.
Use the pie chart to view the number of users in each status.
Maximum Time in Status
This bar chart visualization displays the maximum amount of time (hh:mm:ss) that an agent has been in a status, by workgroup.
Use the pie chart to view the total time agents have been in a status (hh:mm:ss).
Agent Statistics
This grid visualization displays the Workgroup, User, Status, and Time in Status.
Elements used in the Agent Status Dashboard
The following tables provide descriptions of the dashboard visualization elements.
Number of Users in Status (Workgroup)
|
Dashboard Element |
Data Column or Computation |
Description |
|
No. of Agents |
AgentsInStatus |
This is the number of agents in a particular status. |
|
Status |
Status |
This is the agent's status, for the selected statuses. The sample dashboard is displaying the selected statuses: At a Training Session; Available, Follow-Me; Available, Forward; and On a Break. A complete list of available status is listed under Select Status. |
|
Workgroup |
Workgroup |
This is the name of a selected workgroup, for which the number of agents is displayed. |
Maximum Time in Status (hh:mm:ss) (Workgroup)
|
Dashboard Element |
Data Column or Computation |
Description |
|
Time in Status |
TimeInStatus |
This statistic is evaluated by time-in-status alerts. It displays the amount of time that an agent has been in a specific status, by workgroup. |
|
Status |
Status |
This is the agent's status. This dashboard is displaying the selected statuses: At a Training Session; Available, Follow-Me; Available, Forward; and On a Break. A complete list of available status is listed under Select Status. |
|
Workgroup |
Workgroup |
This is the name of a selected workgroup, for which the time in status is displayed. |
Agent Statistics
|
Dashboard Element |
Data Column or Computation |
Description |
|
Workgroup |
Workgroup |
This is the name of a selected workgroup for which the agent statistics are displayed. |
|
User |
User |
The selected user is the name of the agent for which interaction statistics are displayed in the dashboard. |
|
Status |
Status |
This is the agent's status. The sample dashboard is displaying the selected statuses: At a Training Session; Available, Follow-Me; Available, Forward; and On a Break. A complete list of available status is listed under Select Status. |
|
Time in Status |
TimeInStatus |
This statistic is evaluated by time-in-status alerts. It displays the amount of time that an agent has been in a specific status. |