


- Contents
PureConnect CX Insights Help
Create a Report from Scratch
When do you create a report from scratch?
- When you want to build a basic report to address a specific business query.
- When the out-of-the-box reports do not satisfy your needs.
- When you know what attributes and metrics to use.
A simple report generally has at least one attribute, one metric, and one filter. It is not necessary to have all these objects in the report, but the data returned is more meaningful if all these objects are present in the report.
Note: Only users with Designer access can create report from scratch.
Below mentioned information would be needed before creating the report.
- Add required or optional prompts to the report filter panel.
- Create metrics.
- Create required or optional filters.
- Identify the attributes and include them in the report.
- Include the metrics to report.
- Run the report.
Below prompts are included in the Queue Summary Detail report, if prompts are not available then you can create them using Create Prompts.
| Prompts | Prompt Type | Attributes |
| Date Time Range | Attribute Qualification Prompt | Interval Start Date UTC |
| Media Type | Attribute Element List | CHKey4 |
| Skill | Attribute Element List | CHKey3 |
| Report Group | Attribute Element List | Report Group |
Data Time Range Prompt
Considering the Date Time Range prompt as an example of the type Attribute Qualification prompt.
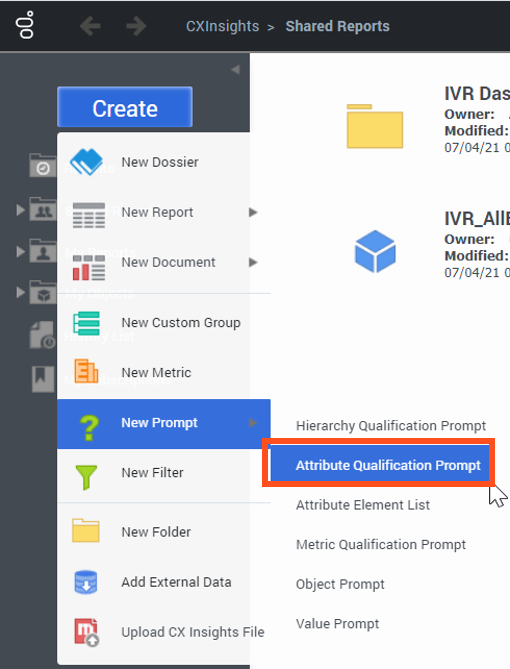
- Click Create > New Prompt > Attribute Qualification Prompt to create a prompt from scratch.
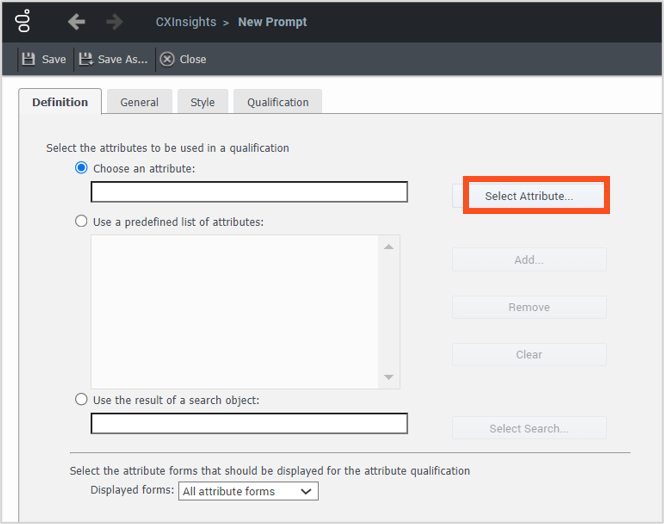
- On the Definition tab, select Choose an attribute radio button. Then, click Select Attribute….
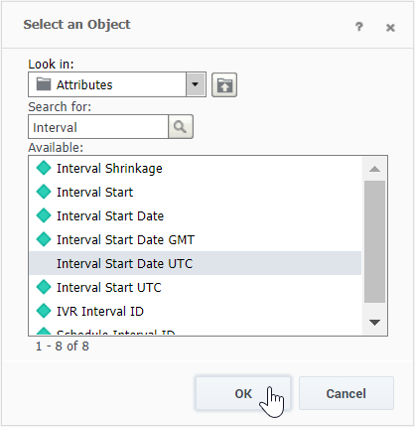
- Search for the Interval Start Date UTC object in the Available: list, then click OK.
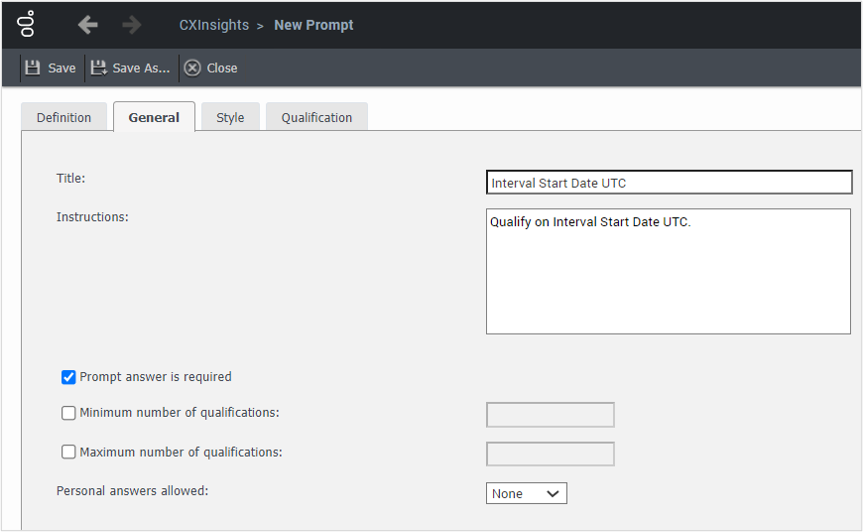
- On the General tab, enter the information in the Title and Instructions boxes, and then select the Prompt answer is required check box.
- On the Style tab, determine the presentation style used to display the prompt to the user.
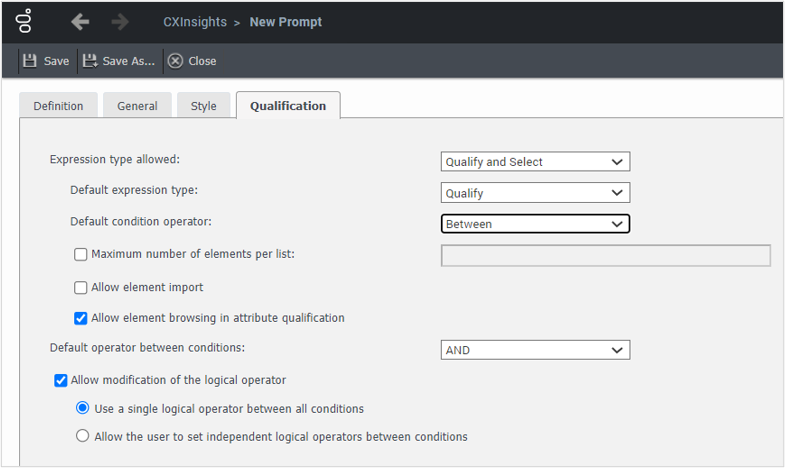
- On the Qualification tab, select the option Between from the Default condition operator list.
- Select the Allow element browsing in attribute qualification check box.
- Select the option AND from the Default operator between condition list.
- Select the Allow modification of the logical operator check box.
- Select the Use a single logical operator between all conditions radio button.
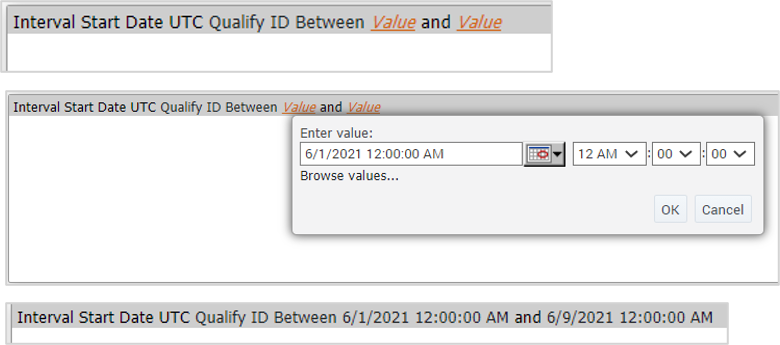
The Data prompt appears as below
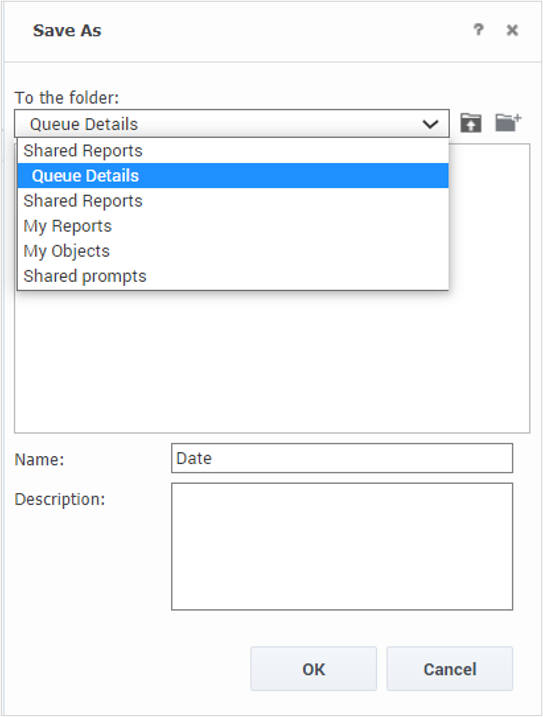
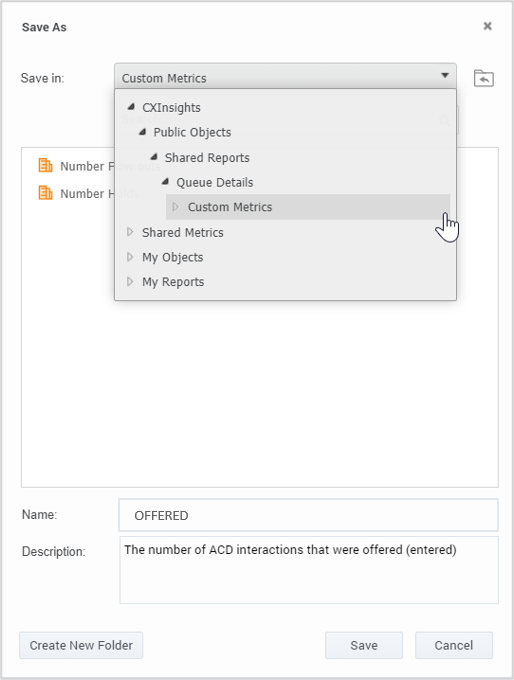
- Save the prompt in the Shared Report folder or My Reports folder in the Save As dialog box.
To create Media Type Prompt, do the following:
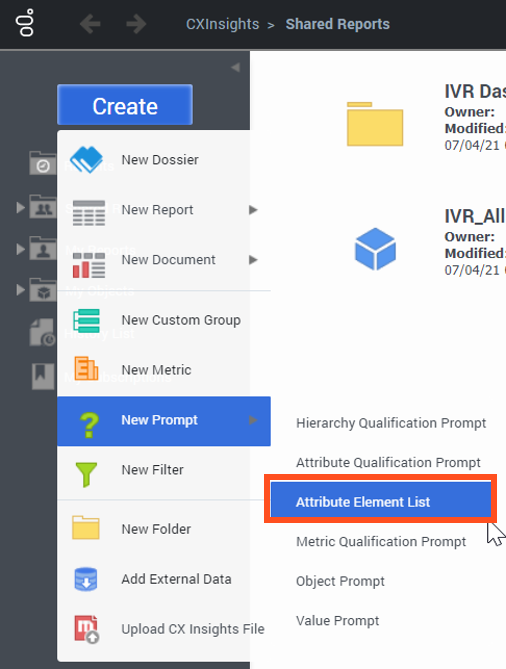
- Click Create > New Prompt > Attribute Element List to create media type prompt.
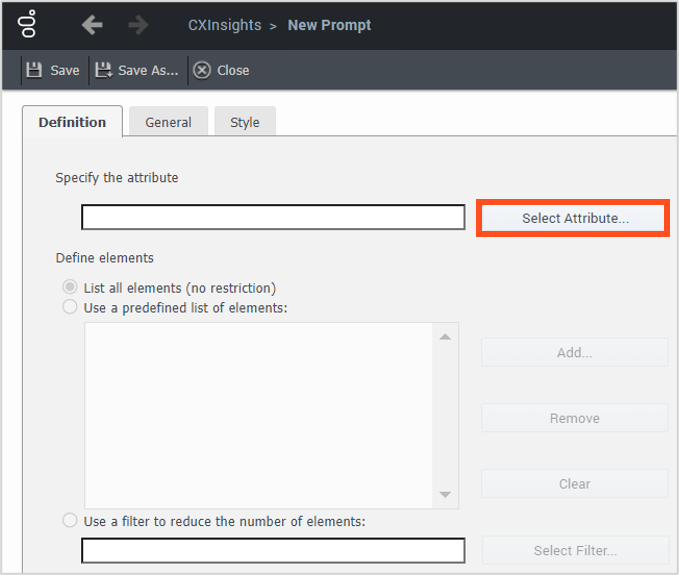
- On the Definition tab, click Select Attribute….
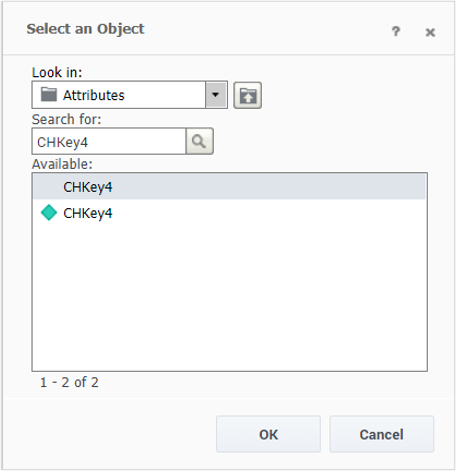
- In the Select an Object dialog box, Search and select the CHKey4 from Search for box then click OK, which represents the Media Type object.
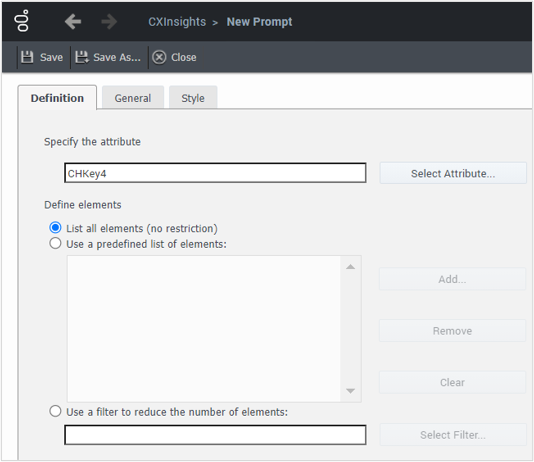
- On the Definition tab, select the List all elements option from the Define elements section.
Note: You can select Use a Predefined list of Elements or Use a filter to reduce the number of elements option, if you want to filter the data for a specific Media Type only.
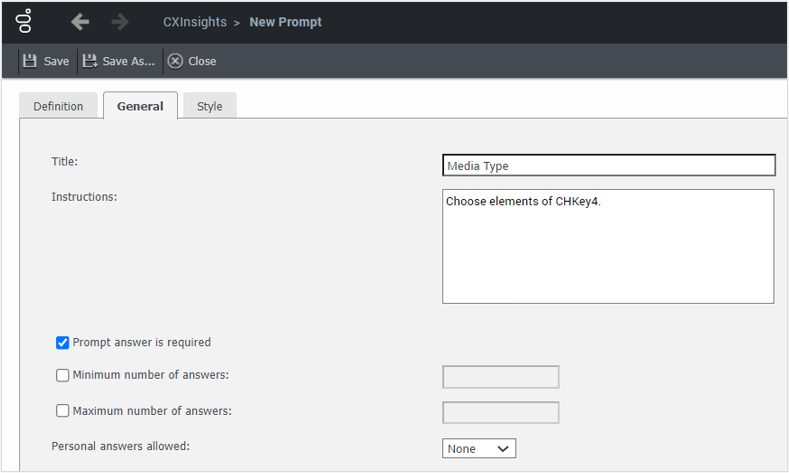
- On the General tab, select Prompt answer is required check box.
Note: Clear the check box, if you want that prompt as an optional.
- On the Style tab, to determine the presentation style used to display the prompt to the user.
- In the Save As dialog box, you can Save the prompt in the Shared Reports folder or My Reports folder.
Note: Similar steps apply for Skill and Report Group prompts creation also.
Alternatively, You can create an adhoc prompt from a report creation.
- In the Report Design Mode, search for Report Group from the ALL OBJECTS section.

- Drag-and-drop Report Group attribute to REPORT FILTER bar.
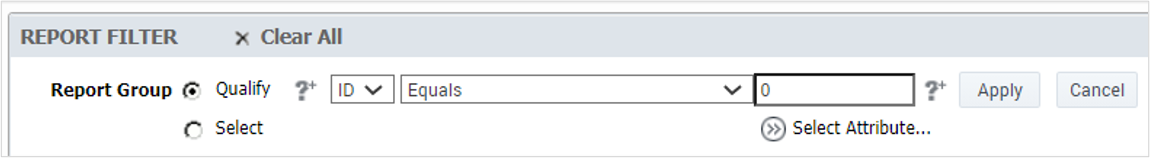
- Opt for the Select option from the Report Group attribute and click Create Element Prompt button to include Element of Report Group in the list prompt.
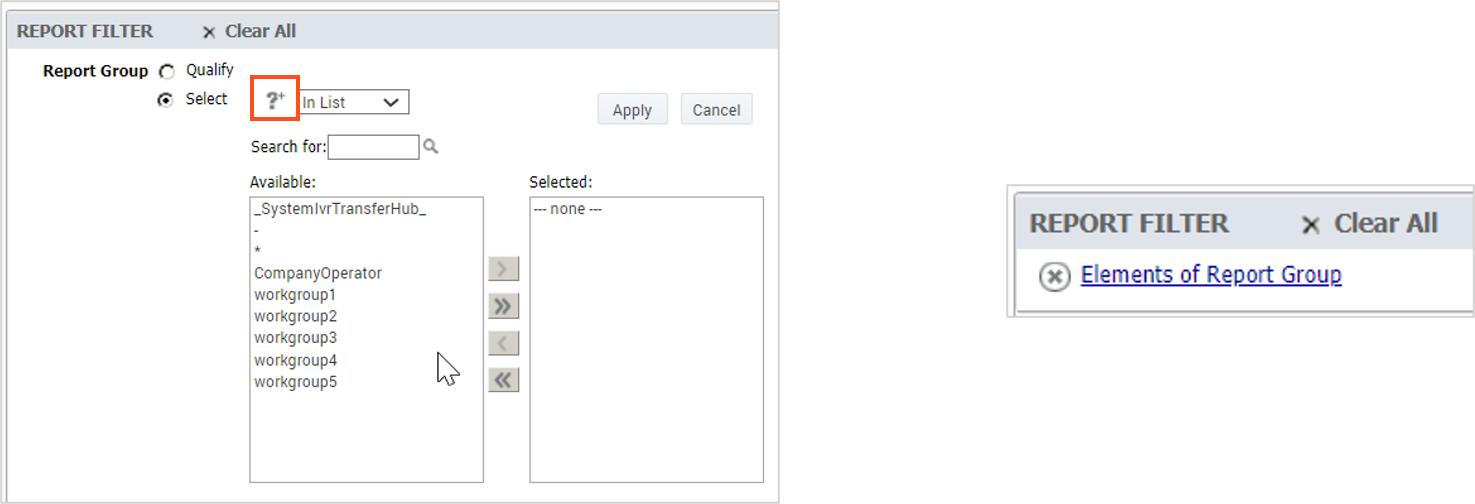
Note: Any adhoc prompt created in a report is only available in that report.
The metrics included in the Queue Summary Detail report are:
|
Metrics Name |
Metrics Report Element | Metrics Description |
| Offered | Sum(nEnteredAcd) | The number of ACD interactions that we offered (entered). |
| ANS # | Sum(nAnsweredAcd) |
Sum(nAnsweredAcd) The number of ACD interactions that were answered. |
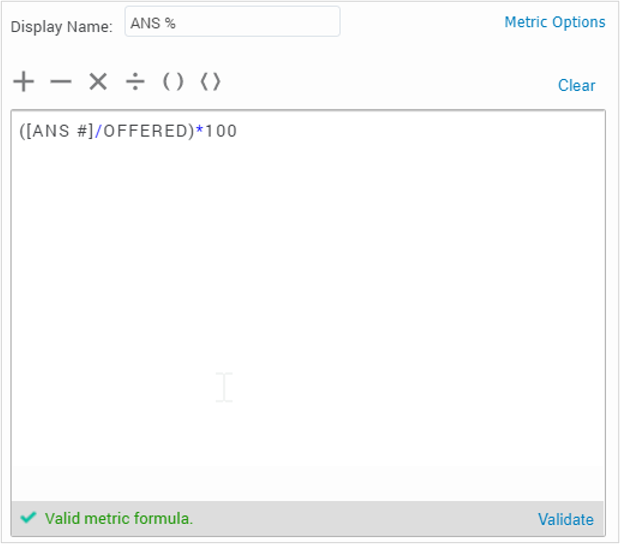
| ANS % | ([ANS #]/Offered)*100 | The percent of ACD interactions that were answered. |
| ABN # | Sum(nAbandonedAcd) | The number of ACD interactions that were abandoned. |
| ABN % | ([ABN #]/Offered)*100 | The percent of ACD interactions that were abandoned. |
| ASA # | (Sum(tAnsweredAcd)/[ANS #])/86400 | The average speed of answer for ACD interactions. |
| ANS SVC LVL % | (Sum(nAnsweredAcdSvcLvl)/[ANS %])*100 | The percent of interactions that were answered within the service level target. |
|
AVG TALK |
((Sum(tTalkAcd)-Sum(tHoldAcd))/[ANS #])/86400 | The average talk time of ACD interactions. |
The metrics included in the Queue Summary Detail report are:
|
Metrics Name |
Metrics Report Element | Metrics Description |
| AVG HOLD | (Sum(tHoldAcd)/[ANS #])/86400 | The average hold time of ACD interactions. |
| AVG ACW | (Sum(tacw)/[ANS #])/86400 | The average after call work time of ACD interactions. |
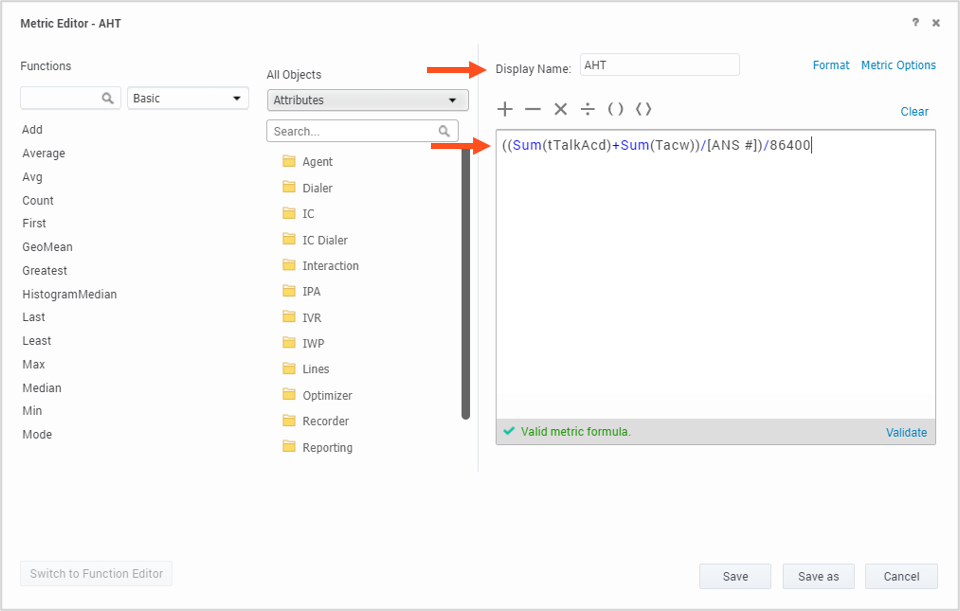
| AHT | ((Sum(tTalkAcd)+Sum(Tacw))/[ANS #])/86400 | The average handle time of ACD interactions. |
| FLOW OUT # | Sum(nFlowOutAcd) | The number of ACD interactions that flowed out. |
|
HOLD # |
Sum(nHoldAcd) | The number of ACD interactions that were held (not the number of holds that occur). |
| ANS | Sum(nAnsweredAcdSvcLvl) | The number of ACD interactions that were answered in service level # (based on the service level configuration). |
| ABN | Sum(nAbandonAcdSvcLvl) | The number of ACD interactions that were abandoned in service level # (based on the service level configuration). |
To Create Metric, do the following:
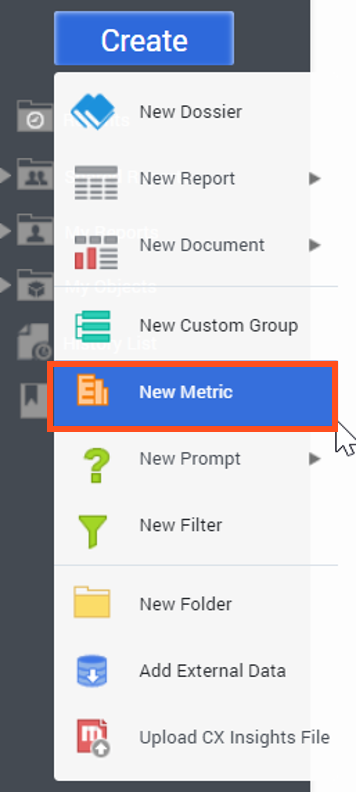
- Click Create > New Metric to create a new metric.
- Click Switch to Formula Editor.
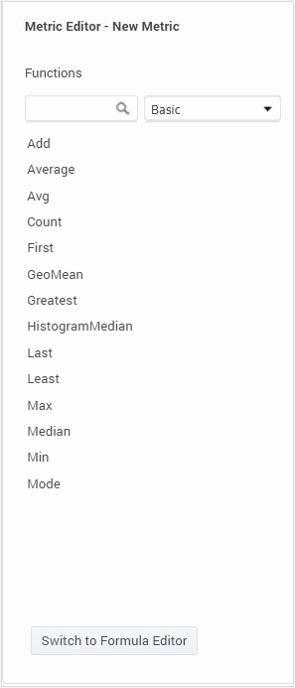
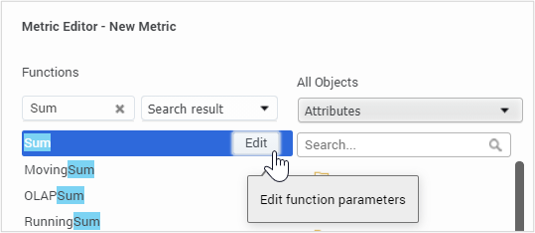
- In Functions section, search for the Sum function. Click Edit.
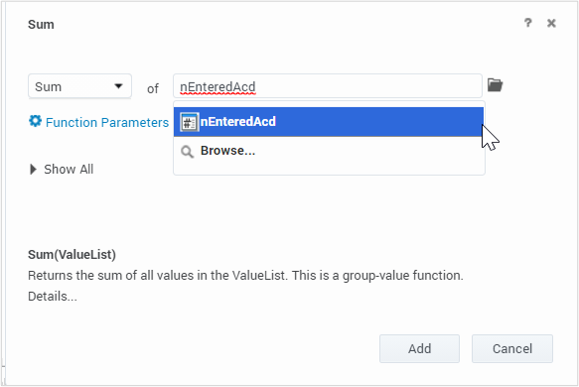
- Search for the nEnteredAcd fact.
- Set the Function Parameters to default.
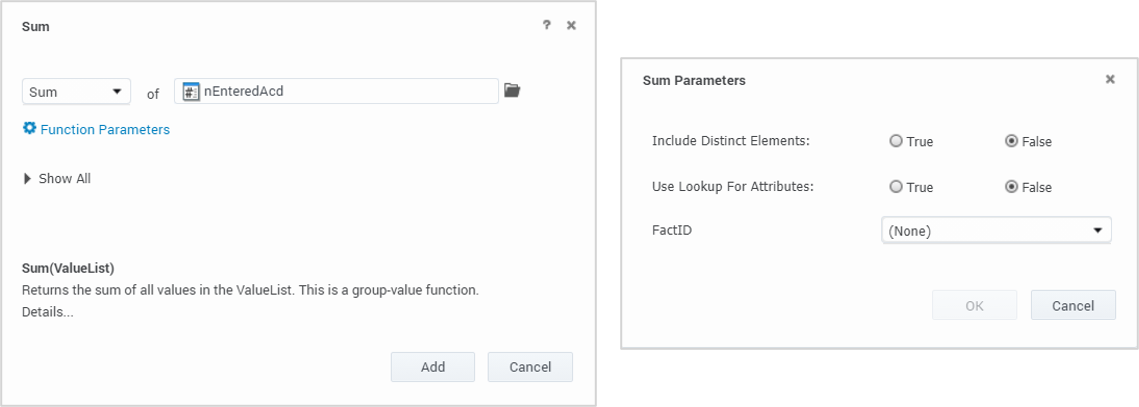
- Set the Level, Condition and Transformation to default.
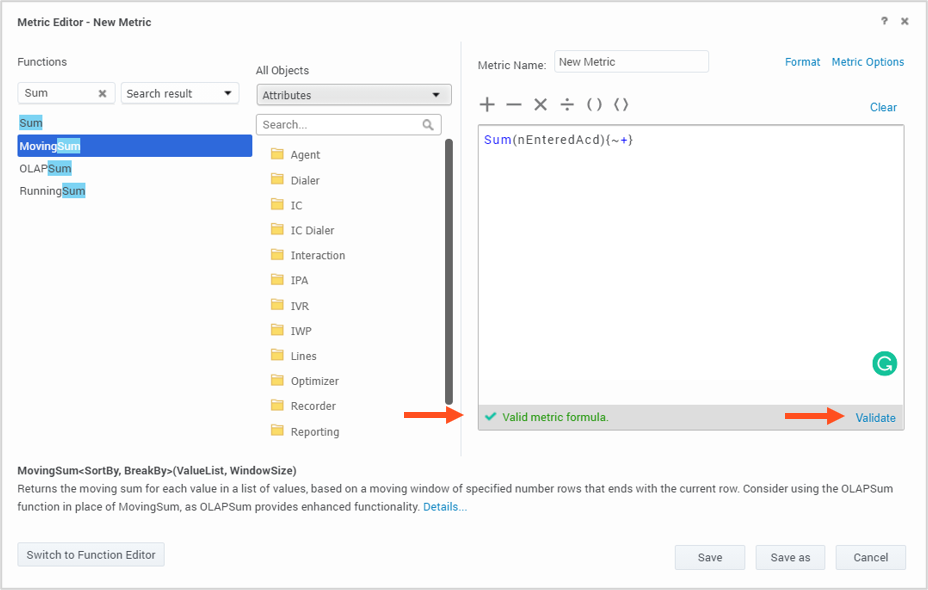
- Click Add.
- Click Validate to validate the formula. Confirm it is valid
Provide a name for the new metric.

- In the Save As dialog box, select Shared Reports or Shared Metrics folder in Save in list and click Save.
- Click Create > New Metric to create a new metric.
- Click Switch to Formula Editor.
- Provide a name and formula for the new metric. Then click Save.
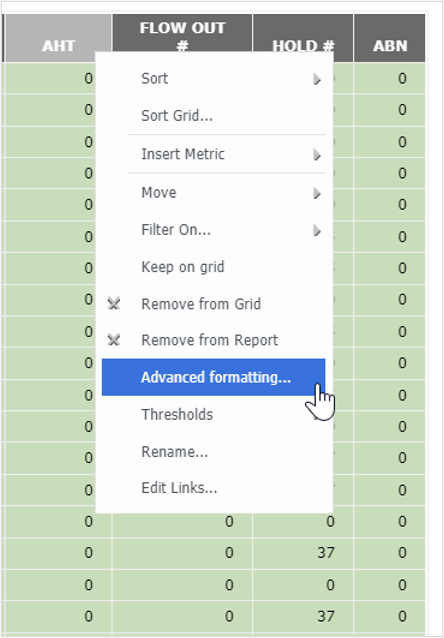
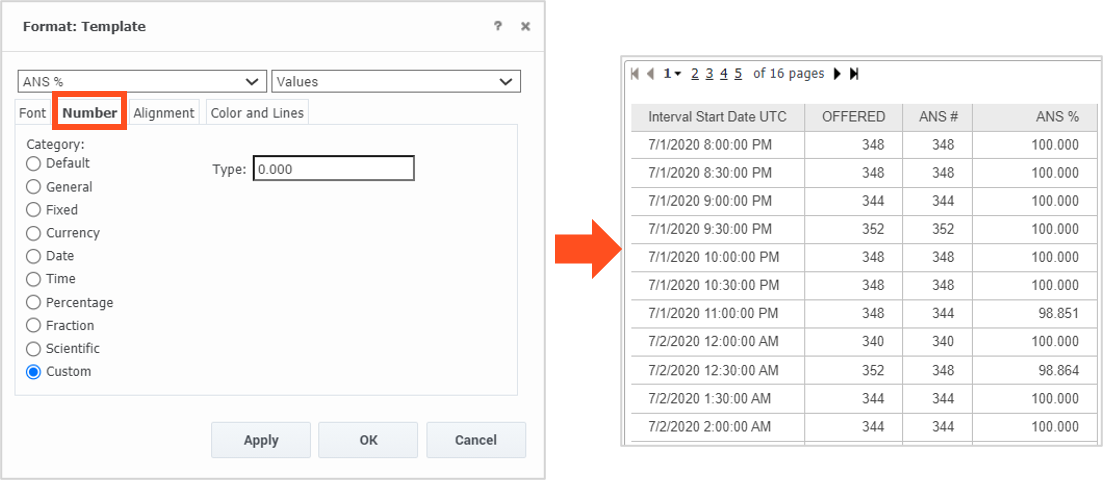
- To display the HH:MM:SS format in the report, right-click AHT and select Advanced formatting….
- In the Format: Template dialog box, click Number tab> Custom and enter HH:MM:SS in the Type folder. Click Apply and then OK.
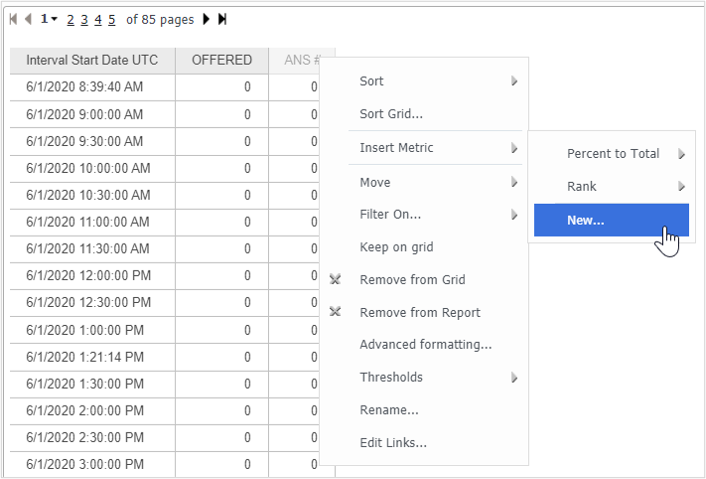
Alternatively, users can create an adhoc metric from a report creation.
- In the report View Mode, right-click one of the columns. Click Insert Metric > New….
To create Ad hoc Metrics - Percentage Answered
The formula for ANS % = (Sum(nAnsweredAcd)/Sum(nEnteredAcd))*100, where
OFFERED = Sum(nEnteredAcd)
ANS # = Sum(nAnsweredAcd)
Users can used Advanced formatting… to change the format.
Note:
Any ad hoc metric created in a report is only available in that report.
User can use Category: Percentage if they omit *100 in the formula.
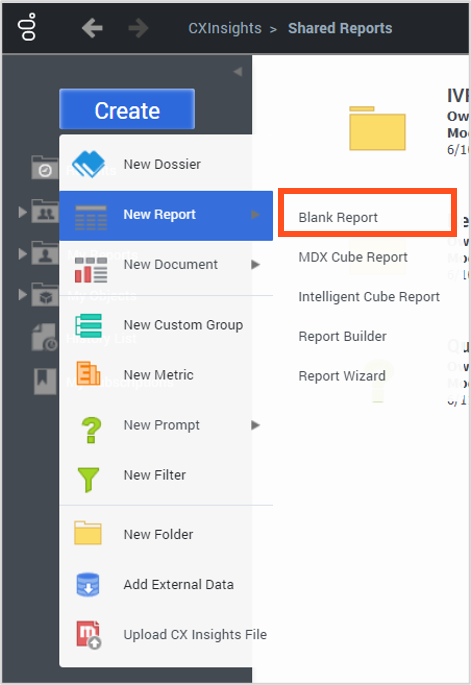
To create a blank Report, do the following:
- Click Create > New Report > Blank Report to create a report from scratch.
The blank report opens in Design Mode as shown, and users can start building the report utilizing Public Objects, Attributes and Metrics in the ALL OBJECTS section.
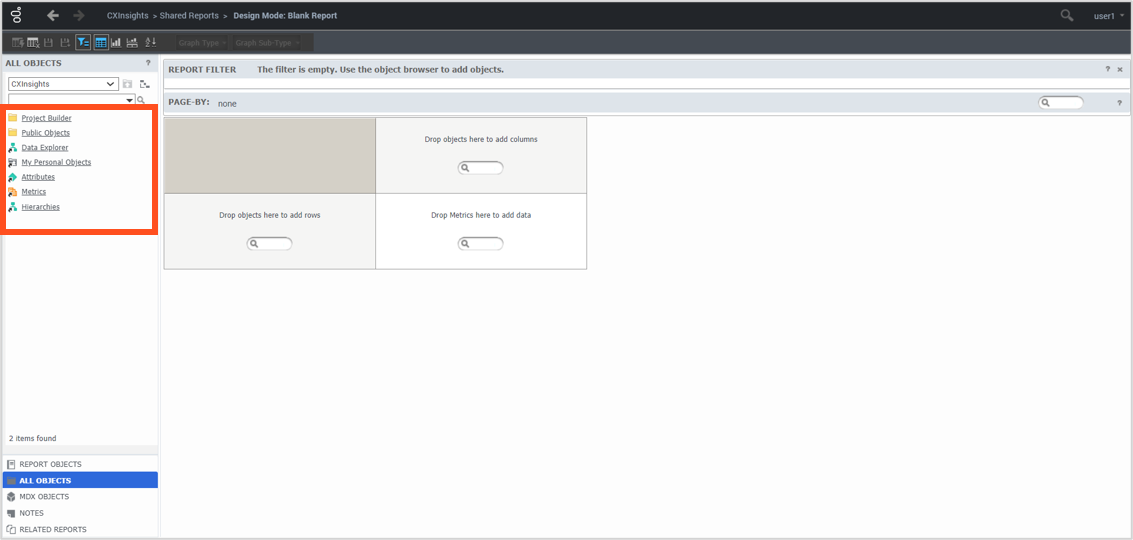
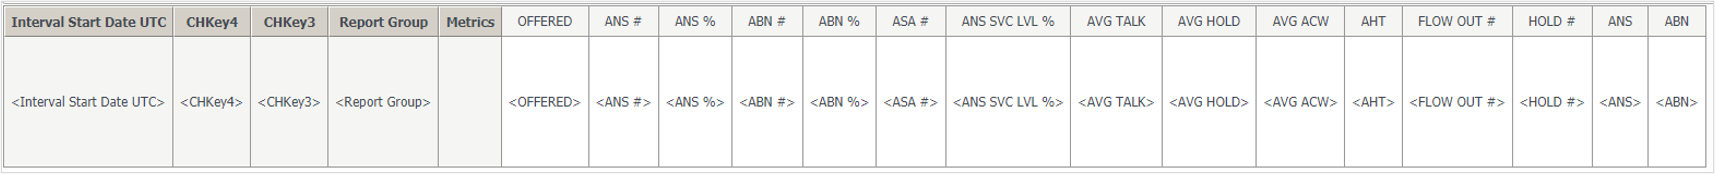
- Drag-and-drop the attributes on the report page.
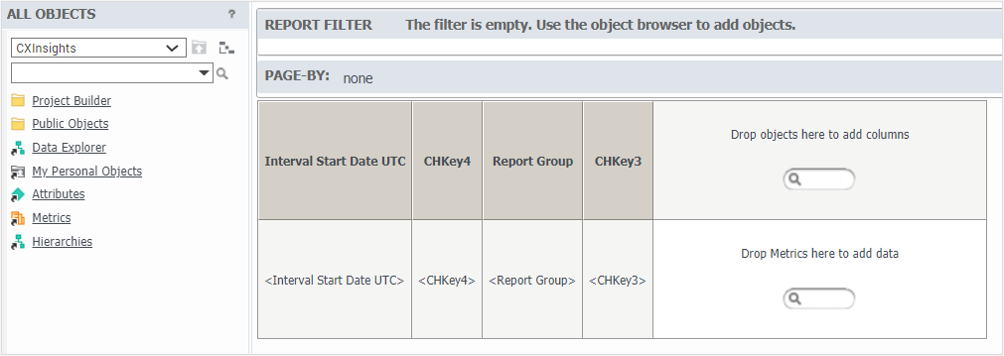
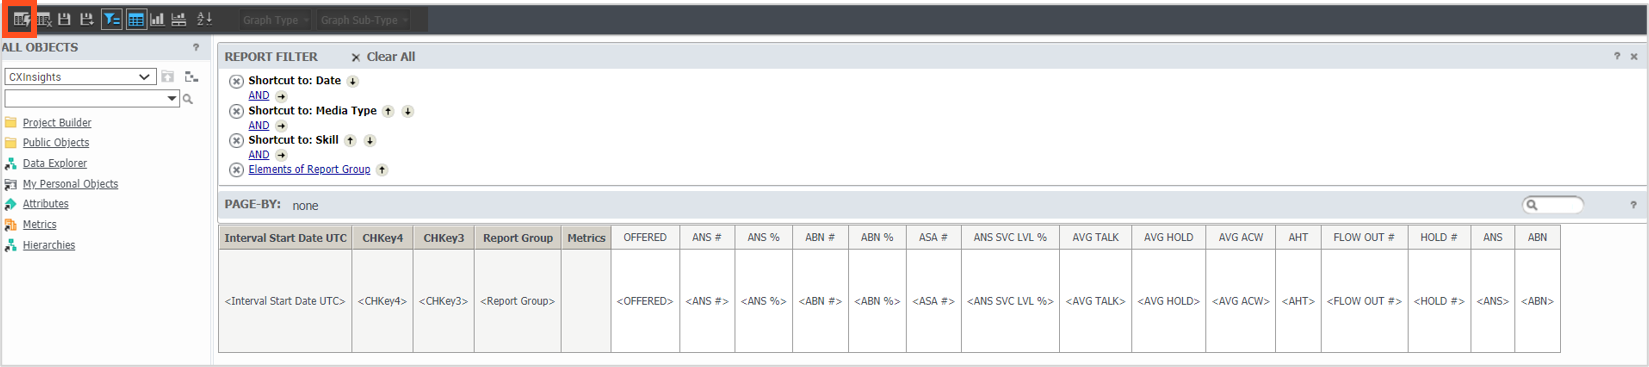
- Drag-and-drop the newly created prompts in the REPORT FILTER section.

- Drag-and-drop the metrics on the report page.
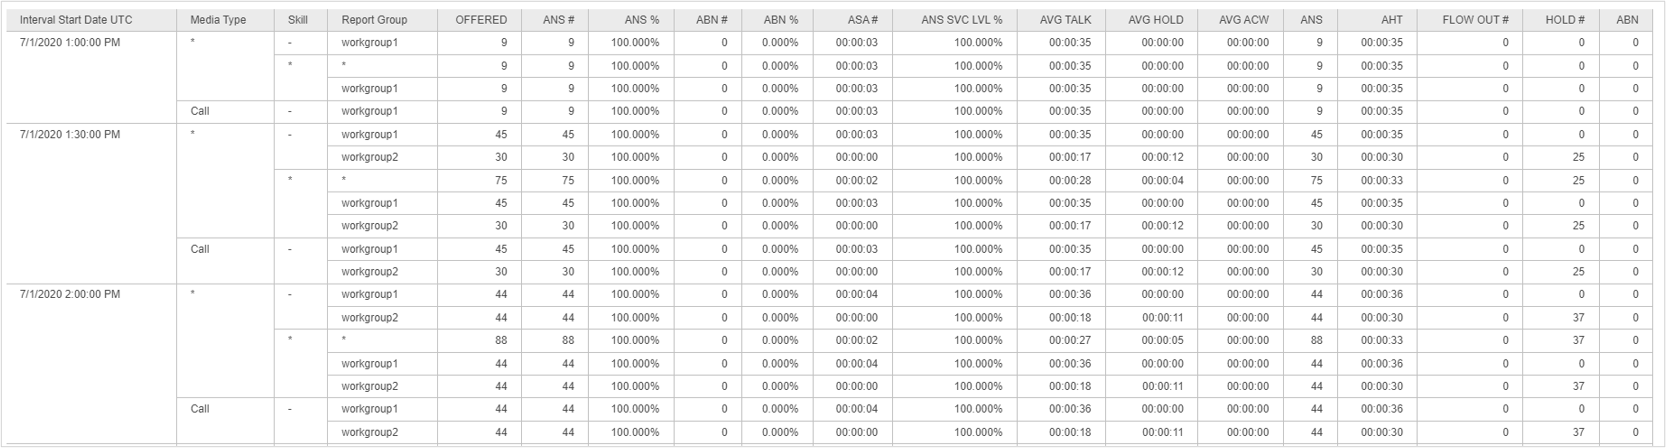
- Click the Run Report icon to run the report.
The prompt details window is as shown.
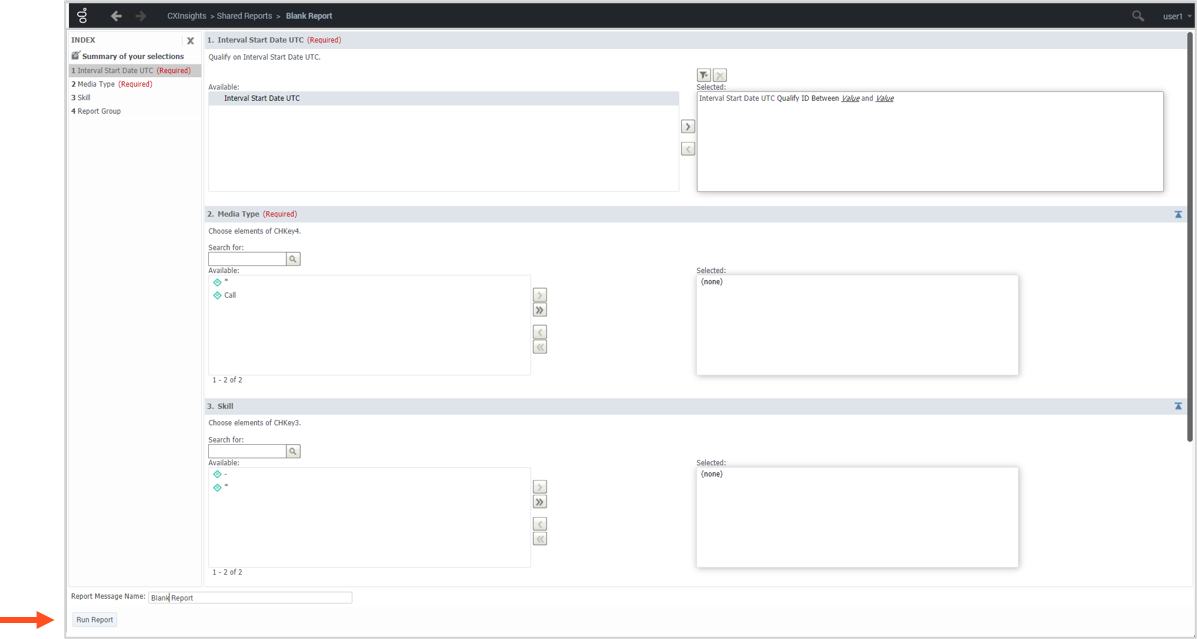
- Click Run Report button.
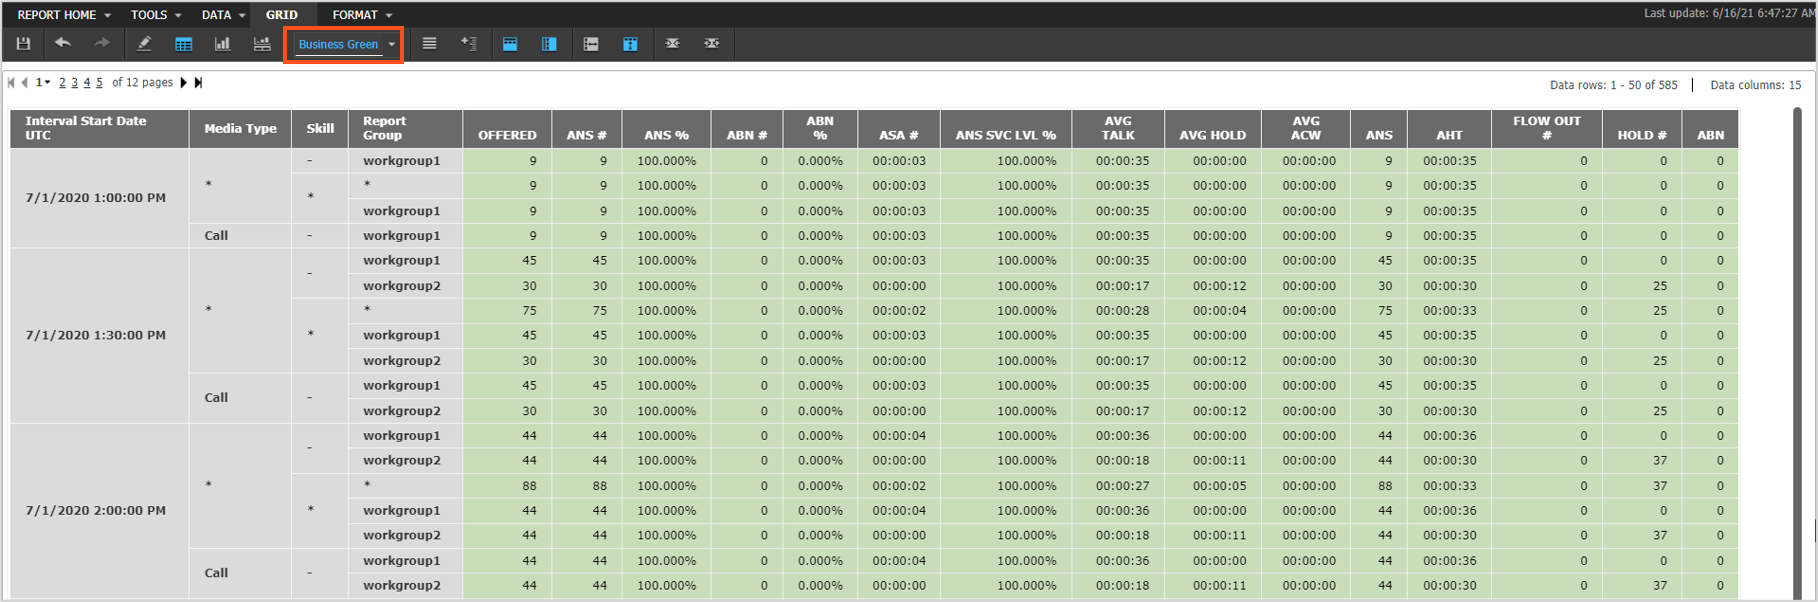
- Save the report into Shared Reports or My Report folder.
- To change the Grid color format, go to the Grid menu and select Business Green from the (Custom) drop-down.
For more information, see