


- Contents
PureConnect CX Insights Help
Workgroup Interval Analysis Dashboard
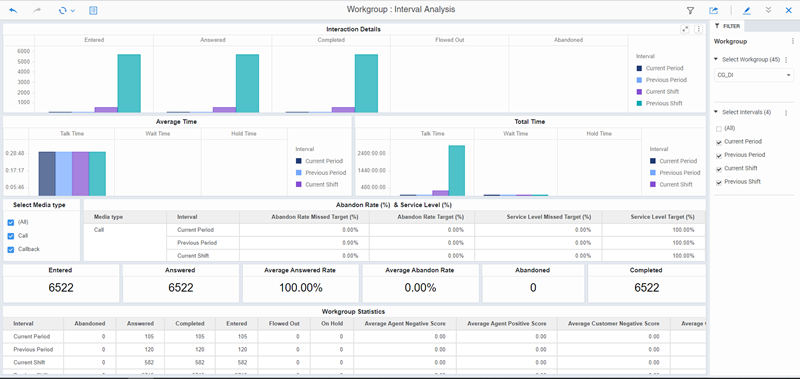
The Workgroup Interval Analysis dashboard displays the number of interaction details for the current and previous shift and period, for a single workgroup. The visualizations include the number of calls answered within the service level target configuration (inclusive) for the selected workgroup queue, the interaction type, and the interval such as Current Period or Previous Period.
The visualizations for the Workgroup Interval Analysis dashboard include Interaction Details (Number of Interactions), Average Time, Total Time, Abandon Rate (%) and Service Level (%), and Workgroup Statistics.
You can include or exclude data in your dashboard visualizations using the filters Select Workgroup, Select Intervals, and Select Media Type.
Dashboard Visualizations
The following visualizations are displayed in the Workgroup Interval Analysis dashboard.
Interactions Details (Number of Interactions)
This bar chart visualization displays the number of interactions Entered, Answered, Completed, Flowed Out, and Abandoned, for a selected interval, by workgroup.
Average Time (hh:mm:ss)
This bar chart visualization displays the agent Average Talk Time, Average Wait Time, and Average Hold Time, for a selected interval, by workgroup.
Total Time (hh:mm:ss),
This bar chart visualization displays the agent Total Hold Time, Total Talk Time, and Total Wait Time, for a selected interval, by workgroup.
Abandon Rate (%) and Service Level (%)
This visualization displays the Abandon Rate Missed Target percent, Abandoned Rate Target percent, Service Level Missed Target percent, and Service Level Target percent, for an Interval, by Media Type.
Workgroup Statistics
This grid visualization displays workgroup statistics by Interval, for interactions: Entered, Answered, Abandoned, Completed Flowed Out, and On Hold. The visualization also includes: Average Agent Negative Score, Average Agent Positive Score, Average Customer Negative Score, Average Customer Positive Score.
To know about the elements used in the Workgroup Interval Analysis dashboard, see Workgroup Dashboards Data Dictionary