


- Contents
Interaction Recorder Technical Reference
Drill Down Graphs
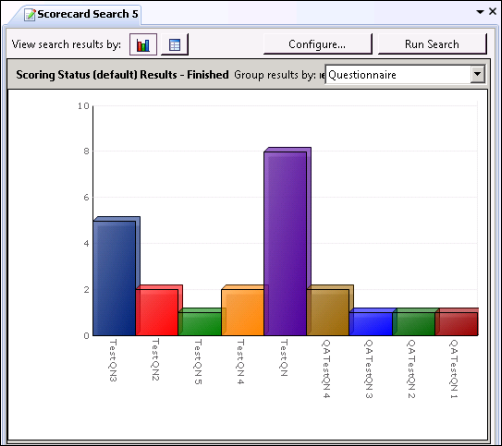
Double-clicking on a slice of the pie chart displays a bar graph for
selected scorecards from the search results, sorted by questionnaire name.
Note
When drilling down in the pie chart, if there is only one questionnaire
associated with the selected recordings in the slice of pie, a bar graph
will not be displayed, and a data grid containing the selected scorecards
is displayed instead.
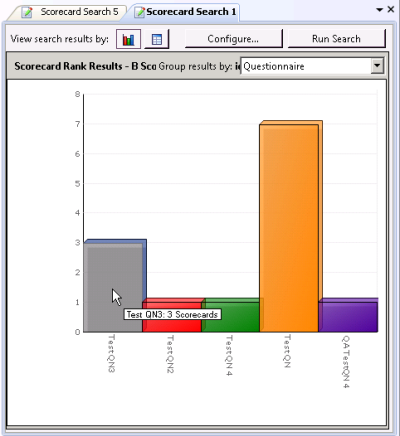
When you pause the mouse on a questionnaire bar in the graph, the number of scorecards for that questionnaire in the search results is displayed.
Double-clicking on a questionnaire bar in the graph displays a data grid that includes the information for the scorecards that used that specific questionnaire.
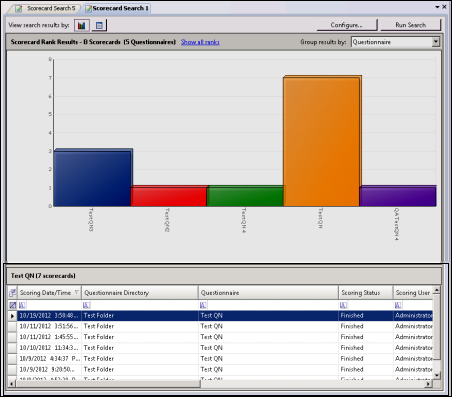
For information on using the data grid, see Scorecard Search Results Grid View.