


- Contents
Interaction Recorder Client for IC Business Manager Help
Working with Scorecard Search Results
You can work with Scorecard Search Results in a Scorecard Search Results Graph View or a Scorecard Search Results Grid View. You can also run a Quality Scorecard Report to generate a report with the details for a scorecard.
Scorecard Search Results Graph View
Click the View search results by graph button  to view all scorecards returned within the search results, displayed in a graph. Use the Search Results graph view to view and sort scorecard results based on drill-down graph data.

The initial default graph is a pie chart grouped by Scoring Status. When you pause the mouse over a slice of the pie, the number of scorecards for that percentage of the search results is displayed. To display the pie chart legend, right-click in the workspace and on the shortcut menu point to View and select Legend.
Use the Group results by drop-down list to display graphs grouped by:
-
Scoring Status
-
Scorecard Rank
-
Scoring User
-
Scored User
-
Questionnaire
Here is a description of the Group results by options.
|
Group results by |
Description |
|
Scoring Status |
Groups the search results by Scoring Status: Assigned, Scoring incomplete, and Finished. The graph displays the percentage of scorecards in each status. |
|
Scorecard Rank |
Groups the search results by Scorecard Rank and displays a graph showing the percentage of scorecards for each Scorecard Rank in the search results. |
|
Scoring User
|
Groups search results by Scoring User and displays a graph showing the percentage of scorecards for each user that scored interactions in the search results. |
|
Scored User |
Groups search results by Scored User and displays a graph showing the percentage of scorecards for each user that was scored in the search results. |
|
Questionnaire |
Groups search results by Questionnaire and displays a graph showing the percentage of scorecards for each questionnaire in the search results. |
Drill Down Graphs
Double-clicking a slice of the pie chart displays a bar graph for selected scorecards from the search results, sorted by questionnaire name.

Note When drilling down in the pie chart, if there is only one questionnaire associated with the selected recordings in the slice of pie, a bar graph will not be displayed, and a data grid containing the selected scorecards is displayed instead.
When you pause the mouse over a questionnaire bar in the graph, the number of scorecards for that questionnaire in the search results is displayed.

Double-clicking a questionnaire bar in the graph displays a data grid that includes the information for the scorecards that used that specific questionnaire.

Show All link
From the bar graph view, to return to a pie chart view, click Show All in the graph title bar. For example, in a bar graph for Scorecard Rank Results, click Show all Ranks to return to the pie chart.

View All
From the bar graph view, to display all the scorecard information for the scorecard represented in the graph, in the Group Results by drop-down list, click View All. The scorecard information is displayed in a data grid.

Scorecard Search Results Grid View
Click the View search results by grid button  to view all scorecards returned within the search results in a grid in the workspace. Use the Search Results grid view to review the details of a scorecard listed in the grid, open a recording for playback, open a scorecard, or run the Quality Scorecard report.
Viewing Scorecard Details
The results of a scorecard search are displayed a grid in the workspace. The grid displays a list of scorecards, by Scoring Date/Time that are found for the search, in descending order (newest to oldest). The Scoring Date/Time field includes the date the scorecard was assigned to a recording or dates associated with a scorecard that is in progress or finished.

Note The Scoring User column displays the names of the users that scored the individual recordings displayed in the Search Results grid. If the user, viewing the Search Results, has the Can Score Recordings Security Policy rights for a recording, the Scoring User name is displayed in the Scoring User column. If the user does not have the Can Score Recordings policy rights for the recording, the scorecard is not displayed in the search results.
To paste recording information into another application, use Ctrl+C in the grid to Copy an entire row, or multiple rows, to the clipboard.
Selecting Fields for the Grid
To change the Fields for the columns that are displayed in the grid, click the Field Chooser  on the top left of the grid. The Show/Hide Columns dialog is displayed.
In the Show/Hide Columns dialog select the Fields to display in the grid.

Sorting Columns in the Grid
To sort a grid column in ascending or descending order, click the Field name.
Refining Search Results
To further refine the search results, use the Filter Criteria selection fields  below each Field. To create a field filter for the search results displayed in the grid, select the field below the Field name. The field search filter is displayed. To select an operand for the search, click . In the drop-down list, select the search criteria. Depending on the field and your selections, an additional dialog might be displayed. The search results are displayed according to your search filter. To clear the filter criteria, in the field click
 ![]() . To clear all filter criteria, click
. To clear all filter criteria, click ![]() at the left on the Filter Criteria selection fields grid row.
at the left on the Filter Criteria selection fields grid row.
Scorecard Search Results Shortcut Menu
When a scorecard is selected in the Search Results grid, you can right-click on the scorecard to display a shortcut menu.

From the Shortcut menu, you can:
-
Open a recording
-
Open a recording and a scorecard
-
Open a scorecard
-
Delete a Scorecard
-
Run a report
-
Export Results Rows
Open a Recording
To open a recording associated with a scorecard, in the grid right-click on the scorecard and on the shortcut menu, click Open Recording. A media player displays the recording.
Open a Recording and a Scorecard
To open a scorecard and its associated recording, in the grid select the scorecard. Right-click on the scorecard, and on the shortcut menu click Open Recording and Scorecard. The scorecard is displayed and the media player displays the recording.
Open a Scorecard
To open a scorecard from the grid, double-click the scorecard in the list. The scorecard is displayed. You can also open the scorecard from the shortcut menu.
Note When multiple internal participants are associated with a scorecard's recordings, the Select Agent dialog is displayed.
Delete a Scorecard
To delete a scorecard from the grid, select the scorecard. Right-click on the scorecard, and on the shortcut menu click Delete Scorecard.
Run a Quality Scorecard Report
A Quality Scorecard Report includes the information contained in the current scorecard, displayed in a report format. Quality Scorecard reports can be generated from the scorecard results grid, from a scorecard, and can also be generated from the recording search results in the Details pane.
You can generate a report on a Finished Scorecard. To generate a report with the details for a scorecard, in the grid right-click on the scorecard and on the shortcut menu, click Run Report. The Quality Scorecard report is displayed in the workspace, and it includes all the details of the scorecard.

You can also generate a report from the current scorecard. When the scorecard is displayed, click Run Report.

Report Toolbar
After generating a report, the report is displayed in a report viewer in the Workspace. The report includes a Report Viewer toolbar with features to assist you while viewing a report.
Here are the descriptions for the toolbar buttons.
|
Toolbar Button |
Description |
|
|
Click this button to display the Table of Contents. The Table of Contents contains two tabs at the bottom of the pane: Table Of Contents and Thumbnail View. |
|
|
To Print the displayed report, click this button. |
|
|
Use this button to Copy the data in a report from the current page to the clipboard. |
|
|
Use the Find button to search for text in a report. When you click the button, the Find dialog is displayed. |
|
|
Click this button to display a Single Page View of the report. |
|
|
To display multiple pages of your report in the Workspace, click the Multiple Page View button. A drop-down menu is displayed. Select the layout to display report pages in the Workspace. You can select up to six pages to display at a time. |
|
|
The Continuous Scroll button allows you to scroll through your report one page at a time. |
|
|
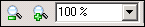
Use these buttons to Zoom Out to see more of a report page or Zoom In to get a close-up view of the report page displayed in the Workspace. You can also enter a particular Zoom Value by typing a percentage or choosing a setting from the drop-down list. |
|
|
Use the Previous Page and Next Page buttons to view pages of your report in consecutive order. You can also enter a specific page number in the Page Index field. |
|
|
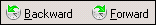
Use these buttons to move Backward and Forward through the history of viewed report pages. |
|
|
Use the Annotations button to add text and graphics to a report displayed in the Workspace. |
|
|
To reload the report, click Refresh. |


Export Results Rows
Export the contents of search results into a CSV, Excel, or PDF file. Export All search results rows, or Selected Rows.
Follow these steps to export All rows from the search results grid:
-
Right-click on any search results row and on the shortcut menu point to Export Results Rows.
-
On the submenu, point to All.

-
Select the file type for the exported file.
-
On the Save As dialog, select the folder to export the Results Rows to, and type a File name.
Follow these steps to export Selected Rows from the search results grid:
-
Select the search results rows to be exported.
-
Right-click on the selected rows, and on the shortcut menu point to Export Results Rows.
-
On the submenu, point to Selected Rows.

-
Select the file type for the exported file.
-
On the Save As dialog, select the folder to export the Results Rows to, and type a File name.