


- Contents
Interaction Supervisor Help
Real-time Adherence view
Summary
The Real-time Adherence (RTA) view monitors agents’ adherence to schedule at all times. It provides instant feedback and helps call centers maintain proactive control over agent schedules.
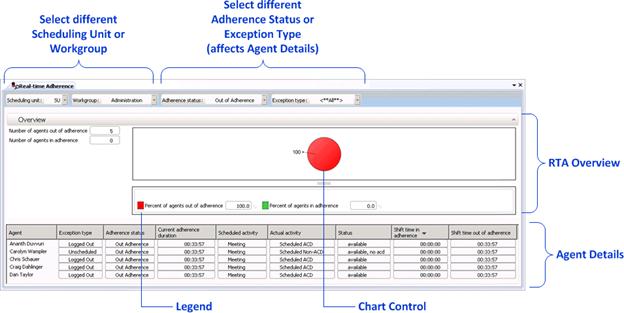
This view identifies users who are in or out of adherence based on a variety of factors. It allows a call center manager to track current agent activity and presence, by comparing actual agent activity with the published schedule.
The display combines overview and agent details in one view. The top section of the view (RTA Overview) indicates how many users are in or out of adherence with the current schedule. This information is also presented in a chart control. The bottom section of the view (Agent Details) provides details about each individual agent's adherence to schedule.
Drop lists make it easy to choose a different Scheduling Unit or Workgroup. Selecting a different Adherence status or Exception type affects Agent Details only.
RTA statistics inform about agents who are currently scheduled. RTA statistics report scheduling unit, workgroup, status, scheduled activity, actual activity (based on status), adherence status, exception type, and adherence time for an agent.
Note: If a workgroup is added to or removed from a scheduling unit in Interaction Optimizer, the change will be reflected immediately in this view.
Add this view
-
If necessary, start IC Business Manager and log on.
-
In IC Business Manager, select a workspace from the Workspaces menu, or create a new workspace to host the view.
-
Select New > View from the File menu. The Create New View dialog appears, listing views by category or product. Licensing and station rights determine the availability of selections.
-
Select Categories from the Group By drop list.
-
In the Categories list, select Interaction Optimizer.
-
Select Real Time Adherence in the list of views on the right.
-
Click OK. The Optimizer Scheduling Unit page of the Real-time Adherence wizard appears.
-
Select the name of a scheduling unit. If many are defined, you can type all or part of the name in the Filter box. When more than 20 schedules exist in the system, only the first 20 are shown, and an indicator (
 ) informs that more agent names
are available. Once you click to select a unit, its name appears in
the Scheduling Unit box. This helps verify your selection.
) informs that more agent names
are available. Once you click to select a unit, its name appears in
the Scheduling Unit box. This helps verify your selection. -
Click Next to Proceed. The Workgroup selection page appears.
-
Click to select a workgroup by name. Optionally use the Filter box to locate specific workgroups by typing all or part of a workgroup name. Once you make a selection, the workgroup name appears in the Workgroup box. This helps verify your selection.
Note that Adherence Status is set to Out of Adherence by default, and that Exception Type is <**All**> by default. These are the most frequently used selections. To accept them, click Finish now to display the view. Otherwise click Next. The Adherence Status page appears. -
Select a status from the list of available statuses. Then click Next. The Exception Type page appears, listing all possible exception conditions. Select a condition, or <**All**> to select all conditions. Click Finish.
Change statistics in this view
-
Right-click any statistic to open a shortcut menu.
-
Choose Select Statistics… from the menu. The Interaction Optimizer Statistic Selection dialog appears. Use this dialog to select which statistics appear in the view.
-
The list on the left contains items that are not currently included in the view. The list on the right contains items selected for inclusion in the view.
Select statistics in the list on the left. Then click Add to move them to the other list. Add All selects all items for inclusion.
Use Move Up and Move Down buttons to optionally change the display order of columns in the view.
To exclude statistics from the view, select items in the list on the right. Then click Remove. The Remove All button excludes all statistics from the view, but at least one must be included. -
Click OK when finished.
Customize the Chart
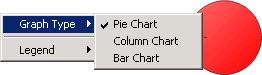
The chart can be customized by:
-
Right-clicking the chart control and selecting a new chart type (Pie, Column, or Bar).
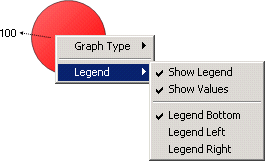
-
Right-clicking the chart control and selecting a new position for the legend relative to the chart. Show Legend toggles the legend itself on or off. Show values toggles display of current values next to each statistic in the legend.
Remove category
To remove a category column from the Agent Details section of the view, right click a column and select Remove Category from the shortcut menu.
Add category
To add a category column to the Agent Details section of the view, right click a column and select Add Category from the shortcut menu. This opens the Interaction Optimizer Statistic Selection dialog, so that you can choose categories to appear in the view.
Display Help for a statistic
-
Right-click the statistic to display the shortcut menu.
-
Select Help. The description of the statistic appears in the Statistic Help dialog.
Set Alerts
See Manage Alerts.