


- Contents
Interaction Supervisor Help
System Graph view
Summary
System Graph views present the relation between different system statistics selected by the user for comparison. When a System Graph view is added, the System Statistics Selection dialog is presented, so that the user can pick and choose statistics from any of the available statistical categories.
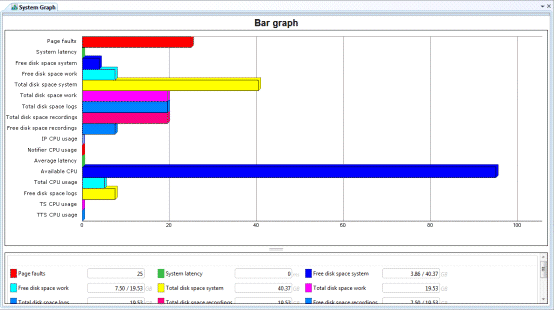
Users are not required to select compatible statistics. For instance, a user can compare values displayed in gigabytes to values displayed as time and percentage. For this reason, graph views are most useful for comparing similar statistics of the same data type, or for watching real-time values of different data types.
Add this view
-
Logon to IC Business Manager if you have not done so already.
-
Select an existing workspace from the Workspaces tab, or create a new workspace to host the view.
-
Select New > View from the File menu. The Create New View dialog appears, listing views by category or product. Licensing and station rights determine the availability of selections.
-
Select Categories from the Group By drop list.
-
Select the System Status view category.
-
Select System Graph from the list of views. Click OK. The System Statistics Selection dialog appears.
-
Choose statistics from any of the available statistical categories by:
-
Select a category in the leftmost list.
-
Select items in the middle list. Then click Add. If you are not sure which statistics to select, briefly rest the mouse pointer over a statistic to display its description.
-
Repeat steps a-c to add statistics from a different category.
-
-
8. When you are finished, click OK to apply selections to the view.
Change statistics in this view
- Right-click in the view to open its shortcut menu.
-
Select Add/Remove Statistics…
-
Use the System Statistics Selection dialog to modify which statistics are graphed.
Customize the Graph
See Chart Control.
Set Alerts
See Manage Alerts.
Display Help for a statistic
-
Right-click a statistic in the Legend below the graph to display a shortcut menu.
-
Select Help. The description of the statistic appears in the Statistic Help dialog.