- Contents
PureConnect Release Notes
CX Insights
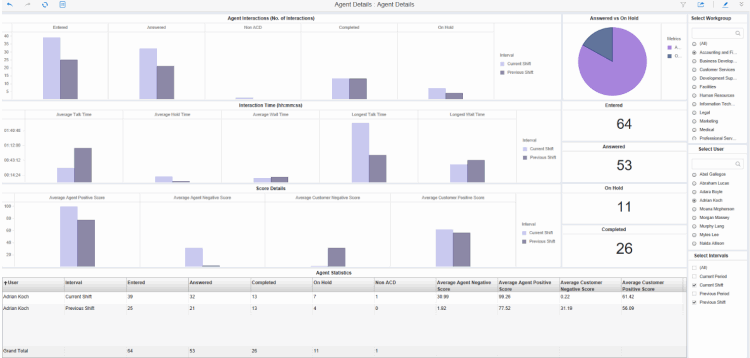
CX Insights is a web-based application that provides the ability to view and analyze PureConnect data through interactive dashboards. Dashboards for Agent and Workgroup statistics are included in this release. The interactive dashboards provide users an easy way to see a wide range of real-time agent and workgroup activity to understand the current state of the contact center. Here is an example of the Agent Details dashboard and its visualizations.

Conditional Release of CX Insights and Social Media Features
For this release we are delivering 11 new CX Insights dashboards for Agent and Workgroup metrics.
-
Agent Details
This dashboard displays individual agent details for a selected workgroup. The visualizations provide statistics for agent: total interactions answered, completed, and on hold. This dashboard also shows the average handling times of an agent and the agent's positive and negative scores. -
Agent Overview
This dashboard displays multiple agent details for a selected workgroup. The visualizations provide statistics for the total interactions answered, completed, and on hold, for multiple agents. The dashboard also shows the average handling times of agents with their positive and negative scores. -
Agent Overview Grid
This dashboard grid displays multiple agent details for a selected workgroup. The visualizations provide statistics for the total interactions answered, completed, and on hold, for multiple agents. The dashboard also shows the average handling times of agents with their positive and negative scores. -
Agent Status
This dashboard displays the number of agents and their time in selected statuses. You can use this dashboard to compare between selected workgroups and users. -
Workgroup Overview
This dashboard allows you to monitor agent status in real-time and view agent interaction details. The dashboard visualizations give supervisors an at-a-glance view of available agents and their current states for a single workgroup. -
Workgroup Interval Analysis
This dashboard displays the number of interactions for current and previous shift and period. The visualizations also show the number of calls answered within the service level target configuration for the workgroup queue, interaction type, and the interval, such as current period or shift. You can filter the data based on workgroup and interval. -
Multiple Workgroup Overview
This dashboard allows you to monitor agent status in real-time and view agent interaction details for multiple workgroups. The dashboard also provides supervisors an at-a-glance view of available agents the their current states, in multiple workgroups. -
Multiple Workgroup Overview Grid
This dashboard grid allows you to monitor agent status in real-time and view agent interaction details for multiple workgroups. The dashboard also provides supervisors an at-a-glance view of available agents the their current states, in multiple workgroups. -
Multiple Workgroup Interval Analysis
This dashboard shows the available interactions for the current and previous shift and period. The visualizations show the number of calls answered within the service level target configuration for the workgroup queue, interaction type, and the interval, such as current period or previous shift. You can filter the data based on multiple workgroups and interval. -
Multiple Workgroup Interval Details Grid
This dashboard grid shows the available interactions for the current and previous shift and period. The visualizations show the number of calls answered within the service level target configuration for the workgroup queue, interaction type, and the interval, such as current period or previous shift. You can filter the data based on multiple workgroups and interval. - Multiple Workgroup Status
This dashboard shows the number of agents in status, for selected workgroups.
For more information on CX Insights, see the CX Insights help.


