- Contents
Interaction Feedback Help
Viewing Survey Results in the Dashboard
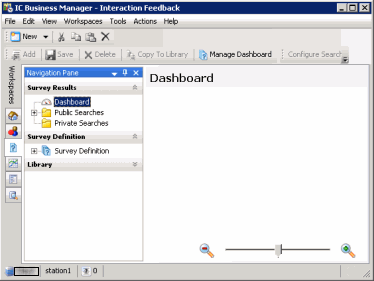
Use the Dashboard to view a summary of individual survey results. From the Interaction Feedback Navigation Pane, under Survey Results, click Dashboard. The Dashboard view is displayed in the workspace.

Managing the Dashboard
Use the Manage Dashboard toolbar button to add individual survey results to the Dashboard. Results are graphically displayed as a speedometer.

Dashboard View
The graphical interface shows the average score for surveys completed since the selected Starting Date. The speedometer also displays the rank and the number of completed surveys.
Dashboard Speedometer
The Dashboard speedometer gives you a quick view of completed survey results. A speedometer is displayed for each survey that has been added to the view using Manage Dashboard.
Speedometer pointer
The average score for the surveys taken is indicated by the pointer, between 0 and 100.
Ranking
The average ranking of a survey is displayed on the face of the speedometer. The text that is displayed depends on the Rank label assigned when creating the Rank Group.
Odometer
The number of completed surveys is displayed by the odometer.
Survey name
The survey name is displayed below the speedometer.
Starting Date
Select this check box to display data for a range of dates beginning with a specific date to the current day.
Date field
Enter a specific date for which to display completed survey results. If the Starting Date check box is selected, the average completed survey results, beginning with this date to the current day, are displayed.
Refreshing the Dashboard view
The Dashboard view is updated with completed survey results every three minutes, or when refreshed. To refresh the view, right-click on the Dashboard, and on the shortcut menu click Refresh.
Defining Surveys to display in the Dashboard
To display completed survey results in the Interaction Feedback workspace:
-
From the toolbar, click the Manage Dashboard button
 .
.
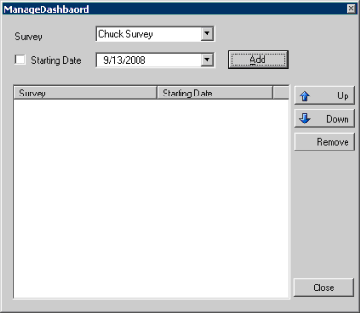
The Manage Dashboard dialog is displayed.

-
From the Survey drop-down list, select the survey to be displayed.
-
To display survey results for a range of dates beginning with a specific date to the current day, select the Starting Date check box. Next, in the date field drop-down, select a starting date on the calendar that is displayed.
Or, to display survey results for a specific date, clear the Starting Date check box, and in the drop-down calendar select the date for which you want the data to be displayed. -
Click Add. The survey is added to the Survey list, and the survey is displayed on the Dashboard.
-
Continue to define as many surveys as you want to display on the Dashboard. When you have completed defining surveys, click Close.
The Dashboard is populated with the completed survey speedometers you have created.
For the steps to create searches to display completed survey information in Interaction Feedback, see Viewing Survey Results Using Searches.


