


- Contents
Interaction Supervisor Help
Chart Control
Summary
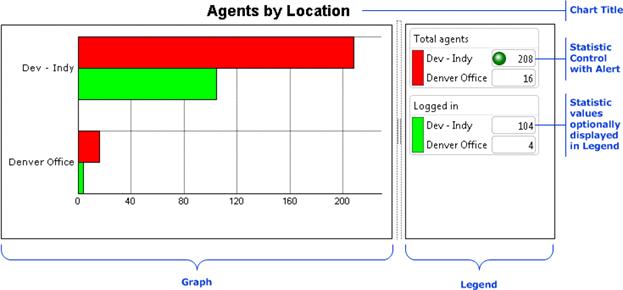
Chart controls are used by graph views to render statistics as column, bar, or line graphs. The graph portion of the chart presents the relation between different system statistics selected by the user for comparison. The optional legend displays statistic values and active alerts.
Customize a Chart
Right-click the chart control to display a shortcut menu of customization commands:
|
Edit Alerts… |
Opens the Edit Alert dialog so that you can change the parameters of alerts. This menu option is only enabled when the shortcut menu is opened by right-clicking on a statistic in the legend. |
|
Add/Remove… |
Opens statistic and parameter selection dialogs used by the view. |
|
Chart options… |
Opens the Chart Options dialog, so that you can change the general appearance of the graph. The items you can modify include the graph title, legend, and axis range information in the graph. |
|
Show Labels |
Toggles display of labels in the graph section. |
|
Graph type |
Displays a sub menu with the following options:
|
|
Group By |
Changes the axis used to display the chart. For example, a System Graph view allows grouping by workgroup or statistic. When grouped by statistic, the example chart looks like this: 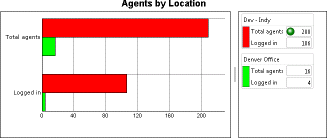
|
|
Legend |
Opens a submenu for setting options relating to the Legend section of the view:
|
For more information about Chart control customization options, see Chart Options dialog.