


- Contents
Interaction Supervisor Help
Chart Options dialog
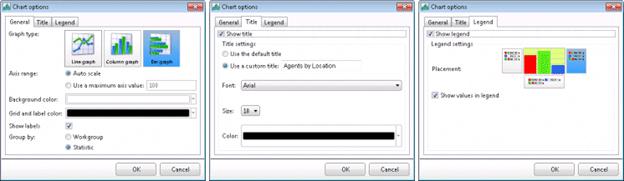
The Chart Options dialog customizes the appearance of a chart control. To open this dialog from a graph view, select Chart Options… after right-clicking a chart control to display its shortcut menu.
The Chart Options dialog has three tab pages:
-
General options set graph type, axis range, time interval for line graphs, background color, and the color of both the grid and labels.
-
Title options manage the title displayed on the graph. The title can be set to a custom value, and the font, size and color of the text can be changed. These settings are not persisted if the user closes and re-opens a new graph view.
-
Legend options determine whether or not the legend section appears below the graph. The position of the legend relative to the graph can also be changed, with the option to show or hide statistic values in the legend. These settings are not persisted if the user closes and re-opens a new graph view.
Important!
Changes to chart settings are displayed immediately in the view, but do not become permanent until you close the Chart Options dialog by clicking OK.
Chart Options Dialog - General page
Options on the General page sets graph type, time interval for line graphs, background color, and the color of both the grid and labels. The customizations you can apply on this page are:
|
Change the Graph type |
Click the Line graph, Column graph, or Bar graph button. To make zero values easier to distinguish, bar and column charts have a 3D effect applied. |
|
|
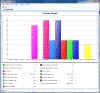
Column graphs display values as a vertical column of color. Column graphs are updated every time a value changes on the server. |
|
|
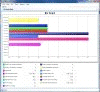
Bar graphs display values as a horizontal column. Bar graphs are updated every time a value changes on the server. |
|
|
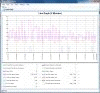
Line graphs display the values across time in a marquee type rolling display. Line graph are updated regularly depending on the total time displayed in the graph. If the user changes a line graph to a column or bar graph, the graph continues to accumulate and display values. This offers the opportunity to return to the line graph later to see its line history. |
|
|
Change the time interval for a line graph |
Select a period from the Line graph period drop list. This option is available for line graphs only. Periods range from 5 minutes to 24 hours. |
|
|
Change maximum value displayed on the Axis |
For column and bar graphs, axis range changes the maximum value displayed on the axis. These settings are not persisted if the user closes and re-opens a new graph view. Select Auto scale to use the default range, or enter and maximum axis value. |
|
|
Change background color |
Click Background color control to open a menu of default colors. 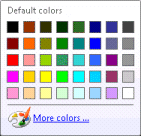
Select a default color or click More colors… to select custom colors from a secondary Colors dialog that allows selection of Standard Windows colors, or any combination selected using a slider control. To apply a custom color selection, click OK. 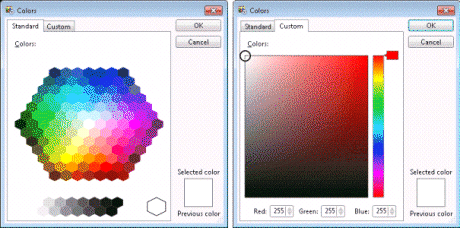
|
|
|
Change grid and label color |
Click the Grid and label color control. Its color selection options work identically to the Background color control. |
|
|
Hide Labels |
To hide labels in the graph section, uncheck the Show labels check box. |
|
|
Group by |
Changes the axis used to display the chart. For example, a System Graph view allows grouping by workgroup or statistic. |
|
Chart Options dialog - Title page
Title options manage the title displayed on the graph. The title can be set to a custom value, and the font, size and color of the text can be changed. These settings are not persisted if the user closes and re-opens a new graph view. The customizations you can apply on this page are:
|
Show or hide graph title |
To show or hide the title, check or uncheck the Show Title box. Checking this box enables other title options on this page. |
|
Change the graph title |
When Title Type is Default, the chart title is based on its type, and the text is Column Graph, Bar Graph, or Line Graph. If you select Custom you can type your own title text in the Custom Title box. |
|
Change title font |
Select a new font from the Font drop list. |
|
Change title size |
Select a new font size from the Size drop list. |
|
Change title color |
Click the Color control to open a menu of default colors.
Select a default color or click More colors… to select custom colors from a secondary Colors dialog that allows selection of Standard Windows colors, or any combination selected using a slider control. To apply a custom color selection, click OK. |
Chart Options dialog - Legend page
The Legend page determines whether or not the legend section appears below the graph. The position of the legend relative to the graph can also be changed, with the option to show or hide statistic values in the legend. These settings re not persisted if the user closes and re-opens a new graph view. The customizations you can apply on this page are:
|
Show or hide the Legend |
Legends are displayed by default. To hide the entire legend section of the graph, check the Show legend box. |
|
Show or hide statistic values |
The value of each statistic is shown in the legend by default. To remove values from the legend, uncheck the Show values in legend box. |
|
Reposition the Legend left, below, or to the right of the chart |
Three Placement buttons determine where the legend appears relative to the graph. Click the button that is left, below, or right of the chart graphic. |