


- Contents
Interaction Supervisor Help
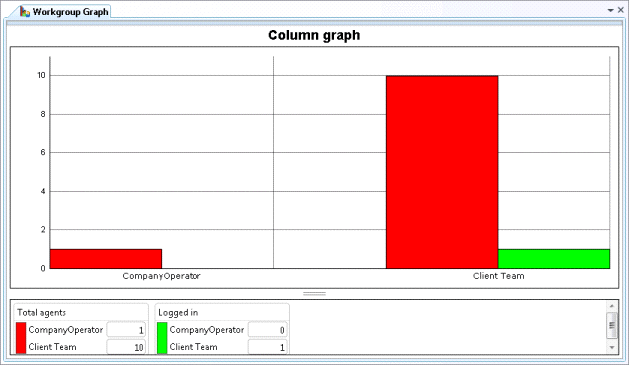
Workgroup Graph view
Summary
A Workgroup Graph view displays rolled-up statistics on selected workgroups presented in a graph.
Add this view
-
If necessary, start IC Business Manager and log on.
-
In IC Business Manager, select a workspace from the Workspaces menu, or create a new workspace to host the view.
-
Select New > View from the File menu. The Create New View dialog appears, listing views by category or product. Licensing and station rights determine the availability of selections.
-
Select Categories from the Group By drop list.
-
In the Categories list, select Agents and Workgroups.
-
Select Workgroup Directory in the list of views on the right. Click OK.
-
Use the Workgroups Selection dialog to select one or more workgroups. You may need to type a name in the Filter box. When more than 20 workgroups exist in the system, only the first 20 are shown, and an indicator (
 )
informs that more are available. If you select more than
20 workgroups, an indicator () informs
that you need to remove some to continue. Click Next.
)
informs that more are available. If you select more than
20 workgroups, an indicator () informs
that you need to remove some to continue. Click Next. -
Use the Workgroup Statistics Selection dialog to select workgroup statistics to include in the view. Workgroup statistics summarize ACD interactions, such as the number of agents logged in, and other particulars that are common to the workgroup as a whole.
-
Select queue statistics and intervals using the Interval and Queue Statistic Selection dialog. Click Finish.
Customize the Graph
See Chart Control.
Change statistics in this view
-
Right-click in the view to open its shortcut menu.
-
Select Add/Remove Statistics…
-
Use the Workgroup Statistics and Queue Statistics Selection dialog to modify statistic selections. Click OK.
Add or remove Workgroups from this view
-
Right-click in the view to open its shortcut menu.
-
Select Add/Remove workgroups…
-
Use the Workgroups Selection dialog to add or remove groups from the view.
Set Alerts
See Manage Alerts.
Display Help for a statistic
-
Right-click a statistic in the Legend below the graph to display a shortcut menu.
-
Select Help. The description of the statistic appears in the Statistic Help dialog.