


- Contents
Interaction Supervisor Help
Summary
The Agent Graph view shows statistics of several agents in one or more workgroups presented in a graph. This view charts Agent Statisticsfor your choice of intervals (current period, previous period, current shift and previous shift).
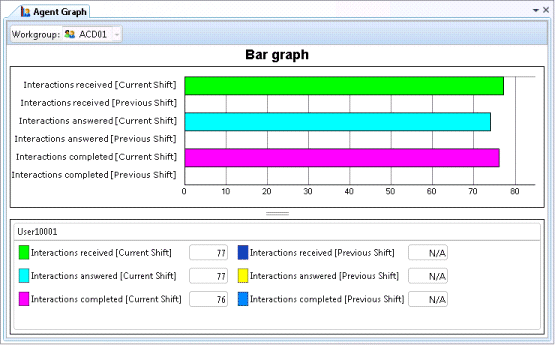
Statistics pertain to time in a workgroup interaction, and not overall time in the system. The time an interaction was in IVR for example, is not counted. Once the view is created, you can select a different workgroup that the selected agents participate in.
Add this view
-
Logon to IC Business Manager if you have not done so already.
-
Select an existing workspace from the Workspaces tab, or create a new workspace to host the view.
-
Select New > View from the File menu. The Create New View dialog appears, listing views by category or product. Licensing and station rights determine the availability of selections.
-
Select Categories from the Group By drop list.
-
Click the Agents and Workgroups view category.
-
Select Agent Graph from the list of views. Click OK.
-
Select a workgroup. Click Next. The Agent Selection dialog appears. (In this context, the dialog title is Agent Graph.)
-
Choose agents to graph by selecting names in the Available Items list on the left. Then press Add.
Add All selects all agents for inclusion. You can change the display order of agents in the view using Move Up and Move Down buttons. To exclude agents from the view, select items in the list on the right. Then click Remove. The Remove All button excludes all agents from the view, but at least one has to be included. -
Click Next. The Interval and Queue Statistic Selection dialog prompts for time intervals to select, and which statistics to chart.
-
In the Interval list, select time intervals to select data for. Then click Add.
Options in the Interval frame manage time periods to select data for. The list on the left contains items that are not currently included in the view. The list on the right contains items selected to include in the view. Select items in the list on the left. Then click Add to move them to the other list, to include them in the view. Add All selects all items for inclusion. You can change the display order of columns in the view using Move Up and Move Down buttons. To exclude periods from the view, select items in the list on the right. Then click Remove. The Remove All button excludes all time periods from the view, but at least one has to be included. -
Select statistics that you want to chart. Then click Add.
Options in the Queue Statistics frame manage statistics to report in the view. The list on the left contains items that are not currently included in the view. The list on the right contains items selected to include in the view. Select items in the list on the left. Then click Add to move them to the other list, to include them in the view. Add All selects all items for inclusion. You can change the display order of rows in the view using Move Up and Move Down buttons. To exclude statistics from the view, select items in the list on the right. Then click Remove. The Remove All button excludes all statistics from the view, but at least one has to be included. -
Click Finish. The Agent Graph view appears.
Change statistics in this view
-
Right-click in the view to open its shortcut menu.
-
Select Add/Remove Statistics…
-
Use the Interval and Queue Statistic Selection dialog to modify which Agent Statistics are graphed. It prompts for time intervals to select, and which statistics to chart.
Add or remove Agents from this view
-
Right-click in the view to open its shortcut menu.
-
Select Add/Remove Agents…
-
Use the Agent Selection dialog to add or remove agents from the view.
Customize the Graph
See Chart Control.
Set Alerts
See Manage Alerts.
Display Help for a statistic
-
Right-click a statistic in the Legend below the graph to display a shortcut menu.
-
Select Help. The description of the statistic appears in the Statistic Help dialog.