- Contents
Interaction Optimizer Help
Use Intraday Monitoring in Graph View
You can use graph view to display the intraday monitoring information in one or more graph tabs. Note: You cannot calculate service levels or ASA on the CIC server.
Add a graph tab to the Intraday Monitoring view
-
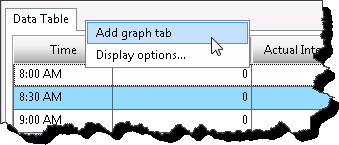
Next to the Data Table tab, right-click and select Add graph tab from the menu that appears.

-
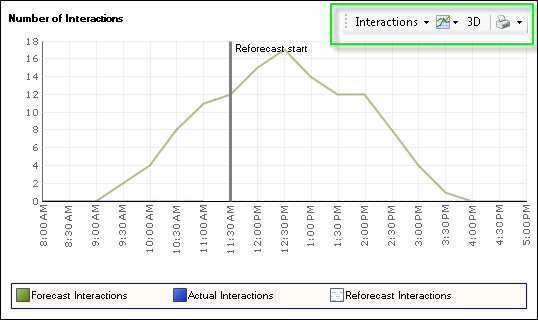
View the intraday monitoring data in the displayed graphs. By default, the number of interactions, the average handle time (AHT) in seconds, the number of full time equivalents (FTEs), and the average interaction time in seconds data is displayed each in four 2-dimensional line graphs (see Set Graph Tabs Display Options to change the display).
Tip: You can change the number of graphs and orientation (for two graphs) by right-clicking on any of the existing graphs and selecting Graph Count.

-
Do any of the following using the graph sub-menu:

-
To select a different display option, click the graph data type drop-down list and select the data type. The default data type is Interactions.

-
To change the graph type to Bar or Line, click the graph type button. The default graph type is Line.
-
To toggle between 2D and 3D, click the dimension button. By default, the graph is displayed in 2-dimensional view.
Tip: When viewing a 3D graph, you can rotate/spin the graph by holding down the [Alt] key and moving your mouse.
-
To print the graph, click the print button to select a printing option.
|
Print... |
Opens the Print dialog box where you can set additional print options. |
|
Quick Print |
Sends the data directly to the default printer for printing. |
|
Print Preview... |
Opens the Print Preview dialog box to see the image of the data. |
-
To remove a graph tab from the view, right-click the tab and select Remove.

-
To display details of an element, hover your mouse over the desired data element .


