


- Contents
Interaction Supervisor Help
Statistic Control
The value of each statistic, and any alerts that have been set, is displayed in its own Statistic Control. In the case of charts, statistic controls appear in the legend. Icons for alerts appear in statistic controls too, if an alert has been triggered. Statistic controls update when the value of a statistic changes, when alerts are triggered, and when the value of the statistic no longer triggers an alert.
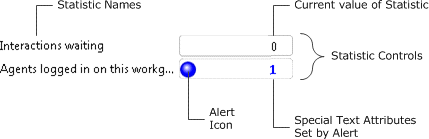
Statistic controls display alerts using color coded icons and conspicuous text attributes. Alerts can be configured to send e-mail notifications, to play sounds, invoke a handler, or to perform all of those actions.
Suppose that a view has two statistics for which alert conditions have been set. Values would appear on statistic controls as shown below:
-
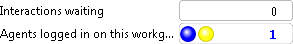
Suppose that for Interactions Waiting, an alert was set to notify when 5 or more interactions are waiting. This statistic does not have an alert icon, since the number of Interactions waiting is currently zero.
-
Suppose that two alert conditions have been set for Agents logged in on this workgroup. The first triggers when the value is less than 3. The second triggers the alert when the value is between 0 and 7. Since both conditions are true, the statistic control displays icons for both. As you can see, an active alert is indicated by a color coded severity icon, and custom text attributes. Both of these properties are specified when alert are set.
An alert condition specifies how the alert is triggered (between two values, exceeds a value, etc.). The severity of the alert determines the color of the alert icon. You can select actions to take when the alert is triggered, ranging from displaying an icon only, to sending email, or invoking a handler. See Manage Alerts.