- Contents
Interaction Reporter Help
Call Answer Distribution Report
The Call Answer Distribution report displays summary data and a graph with analysis on the seconds to answer a call. This report provides guidance on where to set the no-answer timeout. The line chart uses the calculations of the tabular data, and it charts the number of answered calls per seconds to answer.
The information in the Call answer Distribution Report includes:
-
Number of calls
-
Number of calls answered within seconds
-
Percent of calls answered within seconds
-
A Running Total of the percent of calls answered within seconds
Parameters
The following parameters can be specified for the Call Answer Distribution report:
-
Start Data/Time
-
End Date/Time
-
Campaign
-
Site ID
-
Campaign Group
-
Show detail
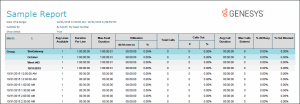
Sample report
Click on the image below to view a sample of this report.

Report Element Descriptions
|
Report Element |
Database Column or Computation |
|
Calls |
sprpt_DialerCallDistribution.TotCalls |
|
Answered within seconds |
sprpt_DialerCallDistribution.SecondsToAnswer |
|
Calls % |
(sprpt_DialerCallDistribution.TotCalls / Sum(sprpt_DialerCallDistribution.TotCalls, Rule GroupID))*100 |
|
Running total % |
( Running Total on sprpt_DialerCallDistribution.TotCalls / Sum(sprpt_DialerCallDistribution.TotCalls, Rule GroupID) )*100 |
Stored Procedure
-
sprpt_CallDistribution2
-
sprpt_CallDistribution_count2


