- Contents
PureConnect CX Insights Help
Agent Details Dashboard
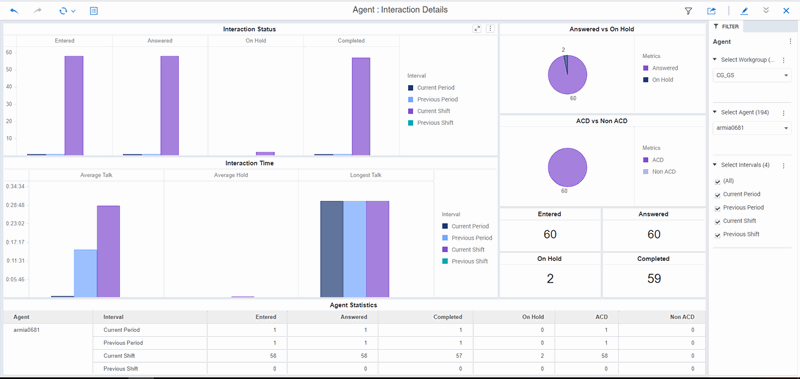
The Agent Details dashboard provides information about agent details, by workgroup. The visualizations display agent statistics for total interactions answered, completed, and on hold. The Agent Details dashboard also displays the average handling times for an agent, with positive and negative scores.
The visualizations for the Agent Details dashboard include Number of Agent Interactions, Interaction Time, Score Details, Agent Statistics, and Answered vs. On Hold, by workgroup. These visualizations include statistics for total interactions answered, completed, and on hold for an agent. Visualizations also include the average handling times of an agent and include the agent's positive and negative scores.
You can include or exclude data in your dashboard visualizations using the filters Select Workgroup, Select Users, and Select Interval.

Dashboard Visualizations
The following visualizations are displayed in the Agent Details dashboard.
Agent Interactions (Number of Interactions)
This bar chart visualization displays the number of agents and their statuses, for an interval of time, by workgroup.
Use the pie chart to compare the number of Answered interactions to the number of On Hold interactions.
Interaction Time (hh:mm:ss)
This bar chart visualization displays the average agent handling times for talk, hold, and wait, by workgroup. And it displays the longest talk time and longest wait time for an interval, by workgroup.
Score Details
This bar chart visualization displays average agent positive scores and average agent negative scores, and average customer negative scores and average customer positive scores, for an interval, by workgroup.
Agent Statistics
This grid visualization displays agent statistics, by user and sorted by interval, for: Entered, Answered, Completed, On Hold, Non-ACD, Average Agent Negative Score, Average Agent Positive Score, Average Customer Negative Score, and Average Customer Positive Score.
To know about the elements used in the Agent Details Dashboard, see Agent Dashboards Data Dictionary.


