- Contents
PureConnect CX Insights Help
Multiple Agent Details Dashboard
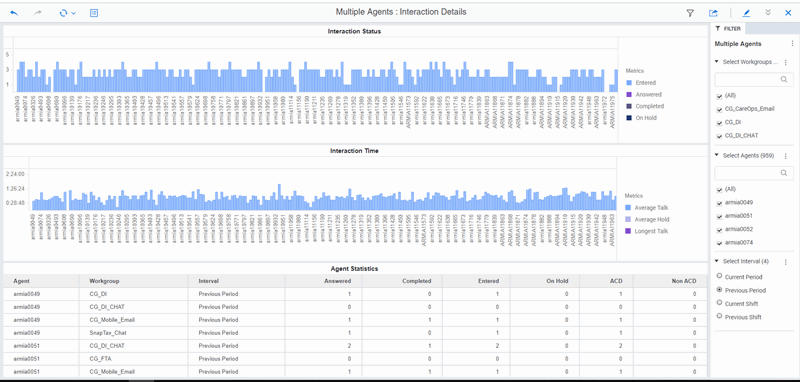
The Multiple Agent Details dashboard provides information about details of the selected agents of selected workgroups. The visualizations display agent statistics for total interactions answered, completed, and on hold for multiple agents. The Agent Details dashboard also displays the average handling times for an agent, with positive and negative scores.
The visualizations for the Multiple Agent Details dashboard include Interaction Status, Interaction Time, and Agent Statistics. These visualizations include statistics for total interactions answered, completed, and on hold for multiple agents.
You can include or exclude data in your dashboard visualizations using the filters Select Workgroup, Select Agents, and Select Interval.

Dashboard Visualizations
The following visualizations are displayed in the Multiple Agent Details dashboard.
Interaction Status
This bar chart visualization displays the interaction statuses for entered, answered, completed, and on hold interactions.
Interaction Time (hh:mm:ss)
This bar chart visualization displays the average agent handling times for talk, hold, and wait, by workgroup. And it displays the longest talk time and longest wait time for an interval, by workgroup.
Agent Statistics
This grid visualization displays agent statistics for Agents, Workgroup, Interval, Entered, Answered, Completed, On Hold, ACD, and Non-ACD.
To know about the elements used in the Agent Details Dashboard, see Agent Dashboards Data Dictionary.


