- Contents
PureConnect CX Insights Help
Multiple Workgroup Overview Grid Dashboard
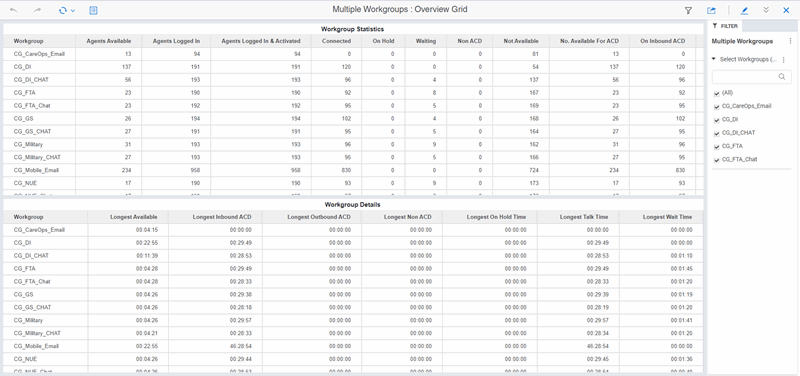
With the Multiple Workgroup Overview Grid dashboard, you can monitor agent status in real-time and view agent interaction details for multiple workgroups. This dashboard provides supervisors a quick view of available agents and their current states, in multiple workgroups.
The visualizations for the Multiple Workgroup Overview Grid dashboard include Workgroup Statistics, and Workgroup Details.
You can include or exclude data in your dashboard visualizations using the filter Select Workgroups.
Dashboard Visualizations
The following visualizations are displayed in the Multiple Workgroup Overview Grid dashboard.
Workgroup Statistics
This grid visualization displays workgroup interaction statistics for: Connected, On Hold, Waiting, Agents Logged In, Agents Logged In and Activated, Agents Available, Not Available, Non-ACD, Number Available for ACD, On Inbound ACD, On Inbound ACW, and On Outbound ACD.
Workgroup Details
This grid visualization displays statistics for: Longest Available Time, Longest Inbound ACD, Longest Outbound ACD, Longest Non-ACD, Longest On Hold Time, Longest Talk Time, Longest Wait Time, and so on.
To know about the elements used in the Multiple Workgroup Overview Grid dashboard, see Workgroup Dashboards Data Dictionary.


