- Contents
Interaction Recorder Extreme Query Help
Working with Search Results
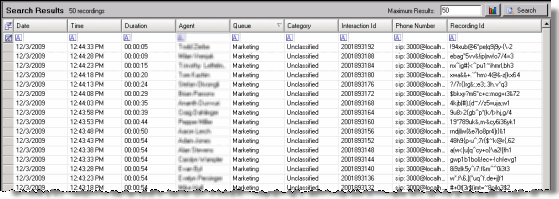
When a search is complete, the results are displayed in the Search Results pane. A list of recorded calls is displayed in a grid, which gives details of the recording. Use the Search Results pane to review the details of a recording and to playback and score a recorded call. Also, you can display the search results in graphs, allowing you to analyze data recording results by Queue, Agent per Queue, and Recordings per Agent.
Search Results grid
The results of a search are displayed in the grid in the Workspace. The grid displays a list of recordings, sorted by date, from the search.
Selecting Fields for the grid
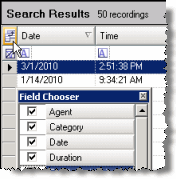
To change the Fields that are displayed in the grid, click the Field Chooser ![]() on the top left of the grid.
on the top left of the grid.
In the Field Chooser dialog select the Fields to display in the grid.
Sorting Columns in the grid
To sort a grid column in ascending or descending order, click the Field name.
Refining search results
To further refine the search results, use the Filter Criteria selection fields  below each Field. To create a field filter for the search results displayed in the grid, select the field below the Field name. The field search filter is displayed. To select an operand for the search, click
  . In the drop-down list, select the search criteria. Depending on the field and your selections, an additional dialog might be displayed. The search results are displayed according to your search filter. To clear the filter criteria, in the field click
  . To clear all filter criteria, click
  at the left on the Filter Criteria selection fields grid row.
Displaying Search Results in a graph
To display results in a Graph, in the Search Results pane click the Show Graph button. 
The View Graph Data page displays the search results in an Agents Per Queue pie graph. Move the mouse pointer over a slice of the pie graph to display information on the number of recordings in a queue.
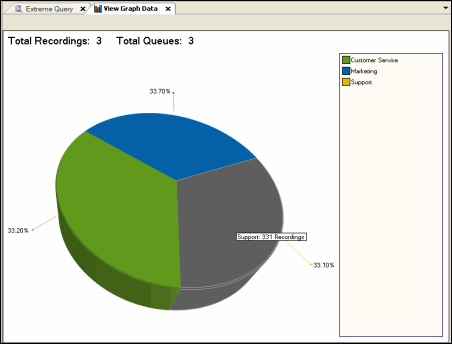
To display a bar graph of Agents and the number of their recordings for a Queue, double-click on a slice of the pie graph. A Bar Graph is displayed.
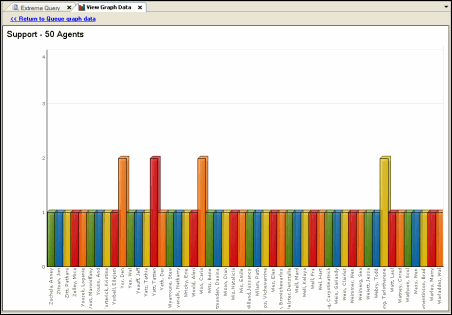
To show information about an Agent's recordings, move the mouse pointer over an Agent's column.
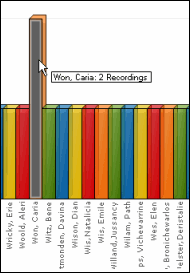
To display the recordings associated with an Agent, double-click the Agent's column. The recordings are displayed in an Agent grid below the graph.
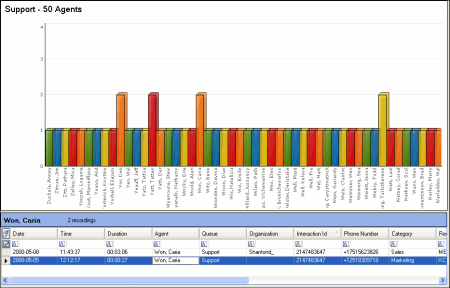
To playback a recorded call, from the Agent's search results pane, in the list of recordings, double-click on a recorded call. The Audio Playback window is displayed, and the recording begins to play.
Related Topics
Creating an Extreme Query Search


