


- Contents
Interaction Supervisor Help
Enterprise Group Details view
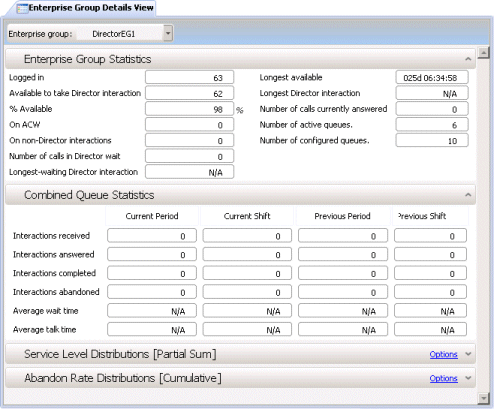
Interaction Director makes intelligent routing decisions that helps balance loads across CIC sites, meet service goals, and increase customer satisfaction. This view displays service level, abandon and queue statistics about an Enterprise Group. Enterprise Groups are logically related queues that conceptually represent the target destination of a routed call.
Each group is a collection of queues from one or more CIC sites where calls could be routed. For example, an Enterprise Group named "Corporate Sales EG" might be comprised of a Sales queue on server CIC_Chicago and a Sales queue on server CIC_Atlanta.
Add this view to the workspace
-
Select an existing workspace from the Workspaces tab, or create a new workspace to host the view.
-
Select New > View. The Create New View dialog appears, listing views by category or product.
-
Select Categories from the Group By drop list. Then click Interaction Director.
-
Select Enterprise Group Details View.
-
Click OK. The Select Enterprise Group dialog appears.
-
Select an Enterprise Group. Click Finish.
Expanders in this view
|
Enterprise Group statistics |
Enterprise Group statistics summarize ACD interactions, such as the number of agents logged in, and other particulars that are common to the Enterprise Group as a whole. |
|
Combined Queue Statistics |
Displays Director agent statistics for interval periods. These statistics summarize the activity of call center agents, by reporting the count of interactions received, answered, completed, and abandoned, along with average wait time and average talk time. |
|
Service Level Parameters |
Display time and histogram intervals for the service level statistic. The range of service level histogram intervals are cumulated downwards by default. You can include or exclude histogram ranges. |
|
Abandoned Rate Parameters |
Displays time and histogram intervals for the abandoned rate statistic. The range of abandon rate histogram intervals are cumulated downwards by default. You can include or exclude histogram ranges. |
Change statistics in this view
-
Right-click in the view to display its shortcut menu.
-
Choose Add/Remove statistics…
-
Use the Select Enterprise Group Statistics dialog to select statistics to display in the view. Click OK.
Select cumulative vs. Partial Sum histogram for Service Level or Abandon Rate statistics
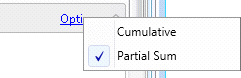
Click Options on the right side of the expander to select histogram type.
Think of cumulative distribution as an accumulative bucket for the enterprise group, interaction type and time interval (current period, current shift, etc.). An accumulative bucket means that each bucket includes the count for all of the preceding buckets. In a partial sum distribution, each bucket count is exclusive of any other bucket.
Set Alerts
See Manage Alerts.