- Contents
PureConnect CX Insights Help
About Dashboards
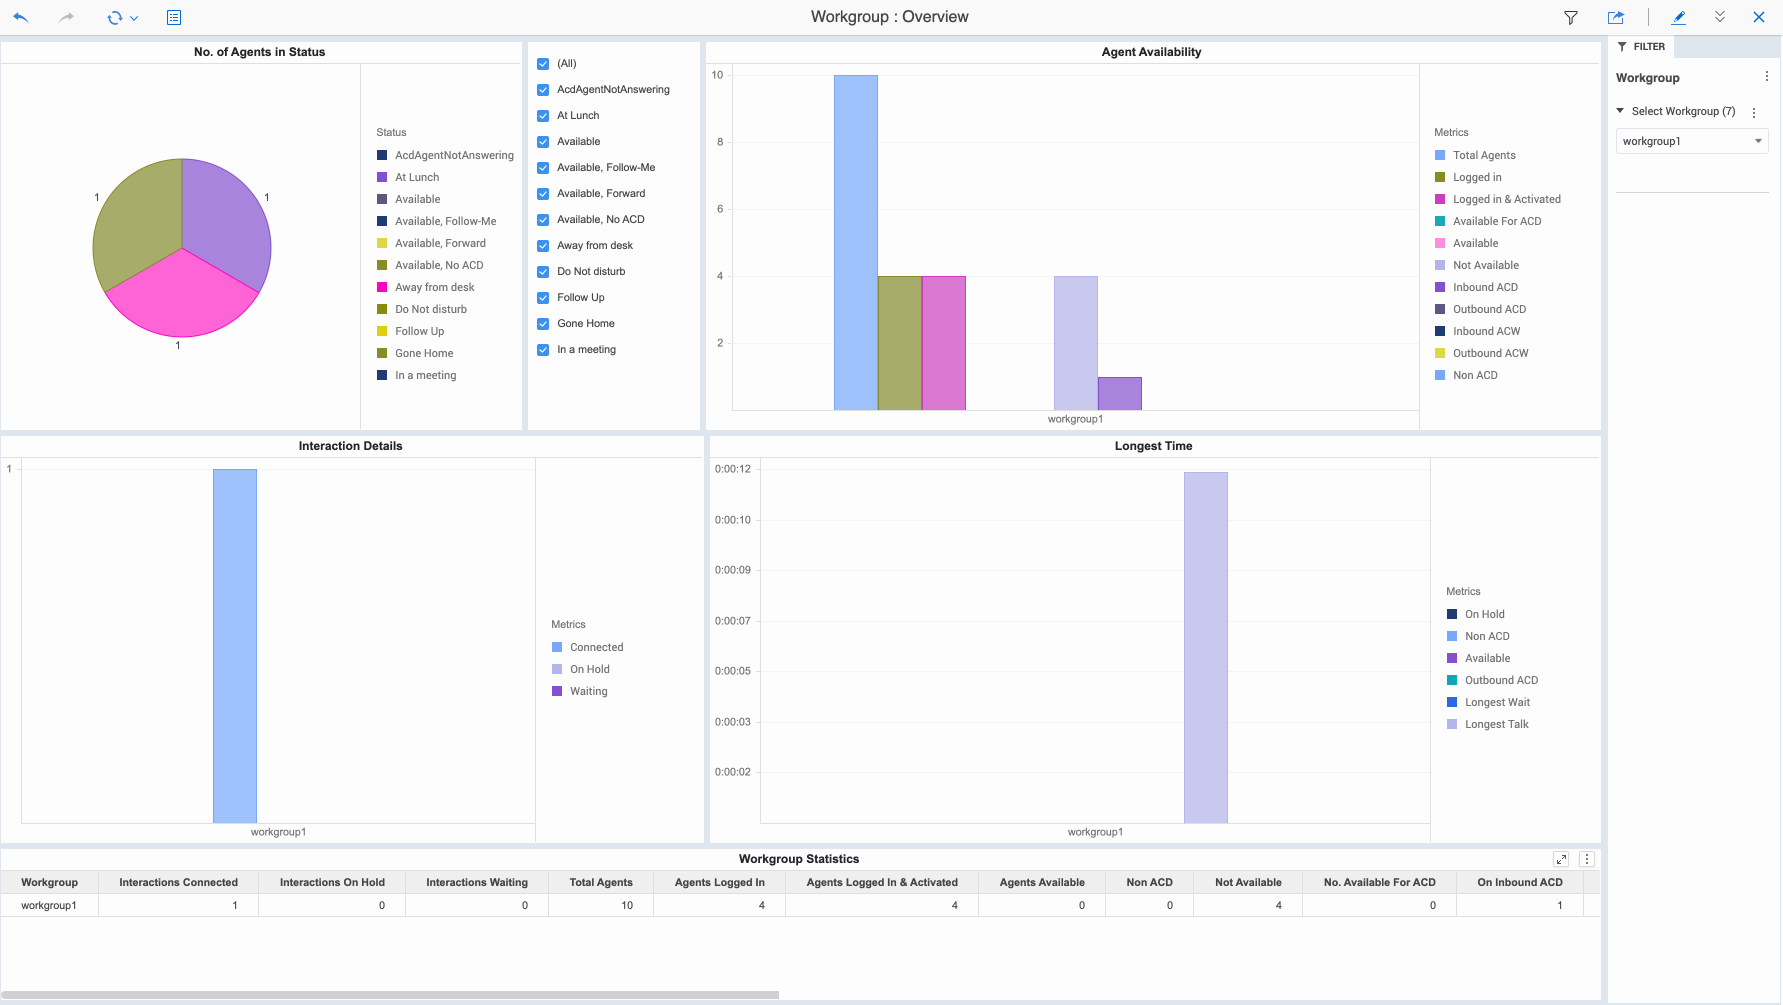
CX Insights displays interactive dashboards that you can use to explore agent data and the current state of your contact center. Visual representations, called visualizations, present the data in the dashboard, for your interpretation. Depending on the dashboard you are viewing, different visualizations are available to analyze your data.
Use the dashboard to:
-
Filter and drill on the data you are interested in
-
Analyze the data in a visualization

Note: During the switch over case, user must log out and then log in as the sync operation works behind, so during this process user will not be able to view dashboards.


