- Contents
Dashboard Help
Dashboard View
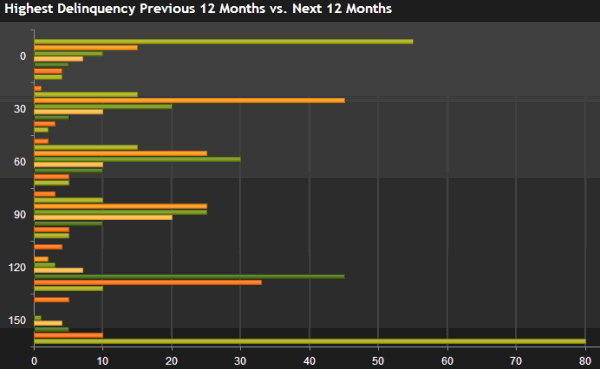
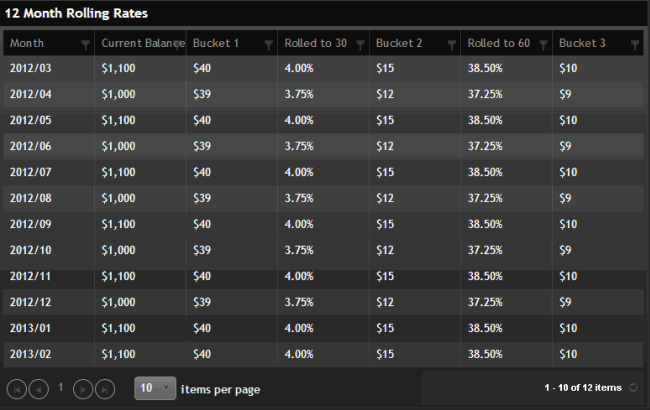
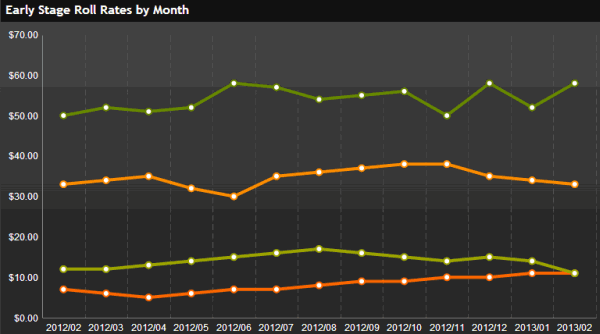
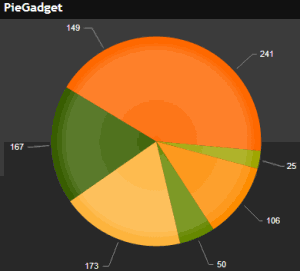
A dashboard displays real-time performance metrics so collectors and managers can analyze collection and performance results. Dashboard presents data using bar charts, data grids, line graphs, pie charts, and text boxes.
Bar chart

Data grid

Line graph

Pie chart


